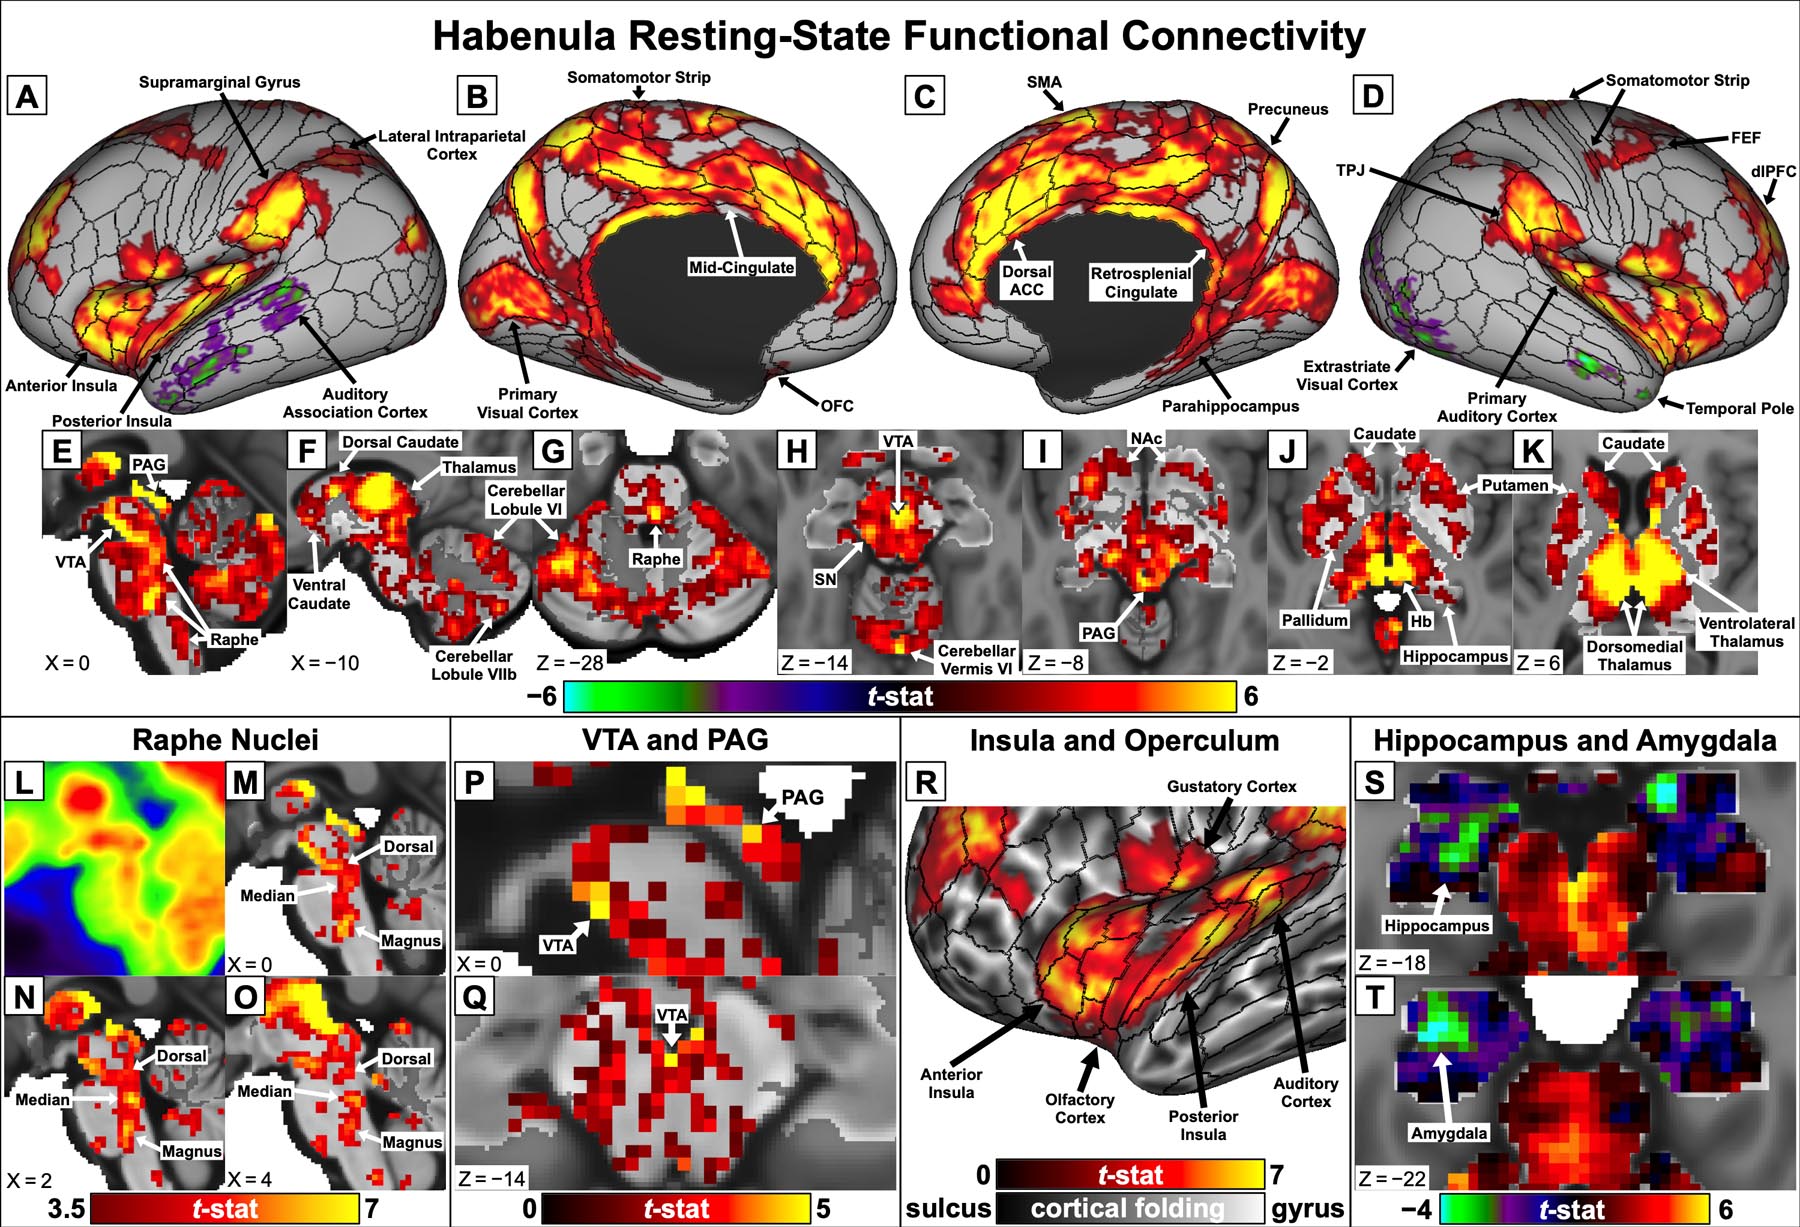
Fig. 4:

Whole-brain Hb resting-state functional connectivity results and expanded views of key findings, displayed on “very inflated” cortical surfaces with areal boundary lines from the multimodal HCP parcellation (Glasser et al. 2016a) and in subcortical MNI space. A–K: Hb connectivity maps for significant (pTFCE-FWE < 0.05) findings in the main analysis. L: Midsagittal view of the brainstem showing locations of human raphe nuclei as peaks in mean [18F]fluorodeoxyglucose positron emission tomography (PET) images acquired from seven healthy adults, displayed in MNI space. Reprinted with permission from Son et al. (2012). M–O: Hb connectivity peaks (t > 3.5) in similar locations along the medial brainstem were identified as dorsal, median, and magnus raphe nuclei. P–Q: Hb connectivity with the VTA and PAG remained significant (pTFCE-FWE < 0.05) even in a secondary analysis without spatial smoothing (additional results presented in Fig. S4). R: Detail of Hb connectivity with the left anterior insula, posterior insula, and sensory regions of the operculum. S–T: Unthresholded negative Hb connectivity with the bilateral amygdala and inferior hippocampus
