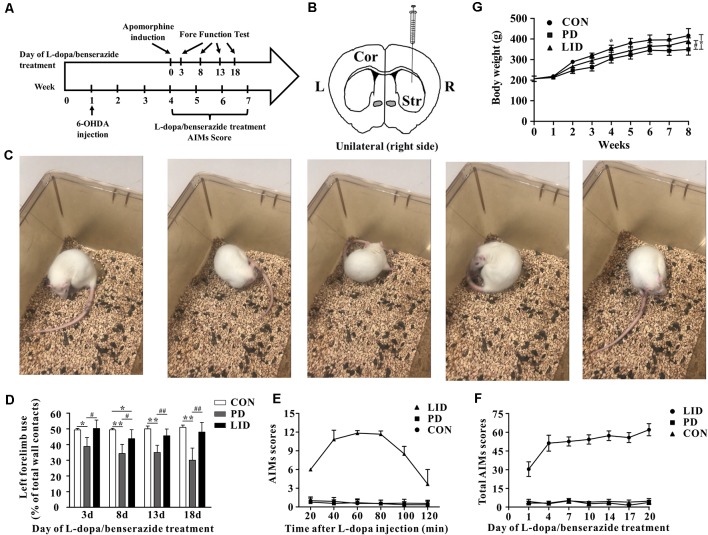
Figure 1.
Behavior performance of the experimental models of Parkinson’s disease (PD) and levodopa-induced dyskinesia (LID). (A) The time scale of the experiments: 6-OHDA lesioning, L-dopa/benserazide treatment, and behavioral tests. (B) Schematic of stereotactic injection of 6-hydroxydopamine (6-OHDA), the rats in the control group received sham-operation with physiological saline at the same location (n = 8–10 for each group). (C) Apomorphine-induced rotation test. (D) Forelimb function tests at days 3, 8, 13, 18 of L-dopa/benserazide treatment. (E) AIMs 120-min time-score plot of three groups after L-dopa injection. (F) Total AIMs scores plot of three groups at Days 1, 4, 7, 10, 14, 17 and 20 of L-dopa/benserazide treatment. (G) Body weight over time of rats from three groups. *Means the difference between Con group and experimental groups (t-test); #means the difference between PD and LID group (t-test). *P < 0.05, **P < 0.01; #P < 0.05, ##P < 0.01.

