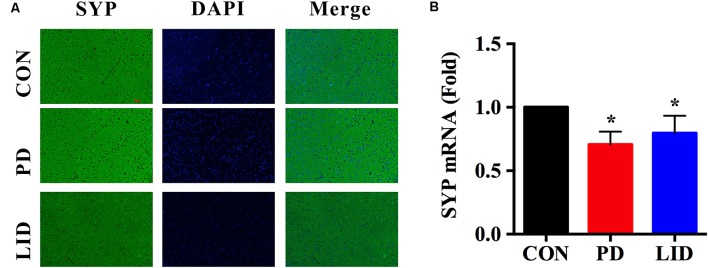
Figure 7.
Gene and protein expression of synaptophysin (SYP) in the right cortex of control, PD and LID rats. (A) Immunofluorescence staining of SYP in the cortex (n = 3–4 for each group): labeling for SYP (Green) and staining nuclei with DAPI (blue). Magnification: X400. Scale bar: 100 μm. (B) Real-time RT-PCR results showed that the expression of SYP in the right cortex in the experimental groups were significantly decreased compared with that in the control group. Differences among the three groups were analyzed using univariate ANOVA. *P < 0.05 is compared with control group.

