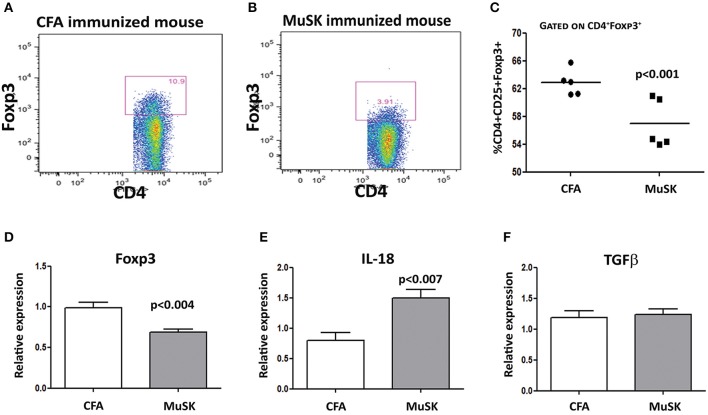
Figure 3.
Decreased Treg cell frequencies in spleens of MuSK-EAMG mice immunized mice. Spleens from control and MuSK immunized mice were harvested at the end of the experiments and analyzed by Flow cytometry and rt-PCR analyses. Representative Flow cytometry analysis of control immunized mouse (A) and MuSK immunized mouse (B). Graphical summary of the frequency of CD4+CD25+FoxP3+ cells (C). Expression levels of FoxP3, IL-18 and TGF-β (D–F, respectively) were evaluated by RT-PCR. β-actin was used as an inner control for normalization. All data are presented as mean ± SEM. Unpaired Student t test has been employed. Representative out of two experiments (n = 12).

