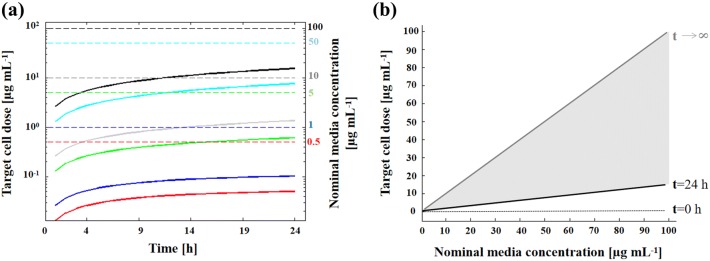
Figure 4.
Target cell doses computed over 24 h. (a) Target cell doses (solid lines) and nominal media concentrations (dashed lines) as a function of time (red: 0.5 µg mL−1; blue 1 µg mL−1; green 5 µg mL−1; grey 10 µg mL−1; cyan 50 µg mL−1; black 100 µg mL−1). Target cell doses are equal to zero at t = 0 (not apparent in the semi-log plot). (b) Target cell doses computed at t = 24 h (black solid line) vs. nominal media concentrations. Notably, only under ideal conditions (t → ∞) are these two concentrations equal (grey solid line). The black dotted line denotes target cell doses at t = 0 h, which are all null regardless of the nominal media concentration.

