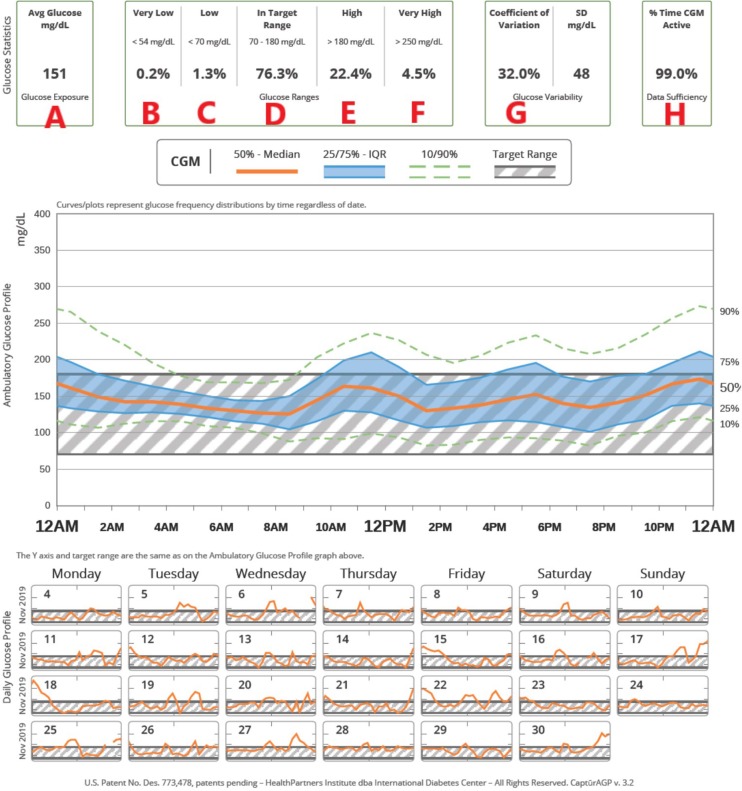
Figure 1.
An example of how CGM metrics are displayed in a standardized ambulatory glucose profile (AGP). (A) Average glucose, (B) Time very low (<54 mg/dL), (C) Time low (<70 mg/dL), (D) Time in target range (70–180 mg/dL), (E) Time high (>180 mg/dL), (F) Time very high (> 250 mg/dL), (G) Coefficient of variation, (H) Percentage of time CGM is active. In the top figure, the hatched area shows the target range; composite data for 14-days are shown as median (orange line), interquartile range (blue shaded area), 10 and 90th percentiles (green dashed line). Individual days are shown below.

