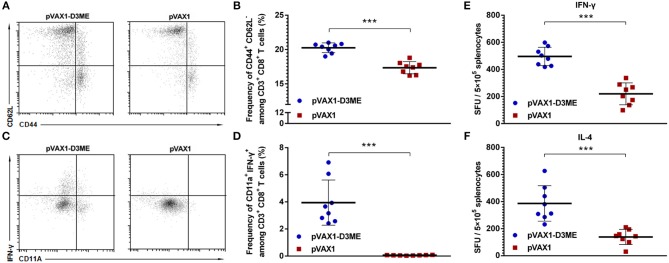
Figure 3.
Cellular immune response against DENV3 in mouse splenocytes. Splenocytes were isolated 1 week after the final immunization. (A–D) The antigen-experienced CD8+ T cell response was assayed by flow cytometry (n = 8). (A) Representative images of CD44+ CD62L− T cells (gated on CD3e+ CD8+ T cells). (B) Quantification of the frequency of CD44+ CD62L− CD8+ T cells. The data are expressed as the mean percentage ± SD from three independent experiments. (C) Representative images of CD11a+ IFN-γ+ T cells (gated on CD3e+ CD8+ T cells). (D) Quantification of the frequency of CD11a+ IFN-γ+ CD8+ T cells. The data are expressed as the mean percentage ± SD from three independent experiments. (E,F) Splenocyte-secreted cytokines detected by ELISPOT assay (n = 8). The number of cytokine-positive cells is recorded as the mean spot-forming unit (SFU)/5 × 105 splenocytes ± SD. ***p < 0.001.

