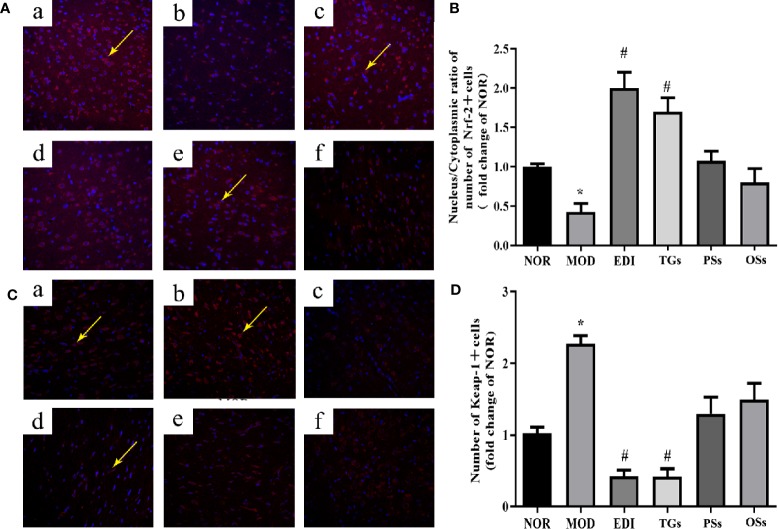
Figure 11.
TGs significantly decrease the expression of Keap-1 and facilitate the nuclear translocation of Nrf-2. Representative images obtained from the cortex penumbraof ischemic hemispheres. (A) Keap-1 dependent Nrf-2 nuclear translocation was observed in I/R rats brain tissue. (C) Keap1 degradation after TGs treatment to I/R rats braintissue. The analysis was carried out using immunofluorescence staining. af are NOR, MOD, EDI, TGs, PSs and OSs groups, respectively. (B, D) Bar graphs show aquantification of the nucleus/cytoplasmic ratio of Nrf-2 and the expression of Keap-1. *P < 0.05 vs NOR, # P < 0.05 vs MOD. Scale bar = 100 mm.

