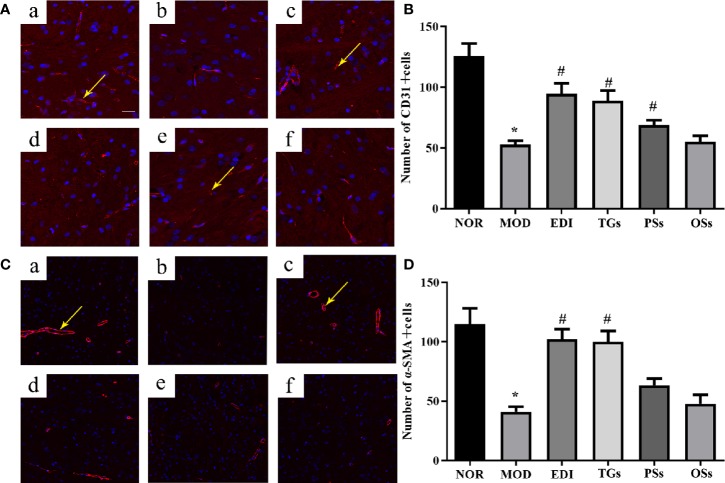
Figure 6.
TGs promote neovascularization in rats with cerebral I/R. Representative images obtained from the cortex penumbra of ischemic hemispheres. (A, C) Representative immunofluorescence images of CD31 and α-SMA in the I/R rats after treatment with TGs, PSs and OSs for 14 days, respectively. a–f are NOR, MOD, EDI, TGs, PSs, and OSs groups, respectively. (B, D) The bar graphs show the analysis of positive immunostaining of CD31 and α-SAM in the I/R rats at 14 days after treatment. *P < 0.05 vs NOR, # P < 0.05 vs MOD. Scale bar in all panels = 100 μm.

