Figure 7.
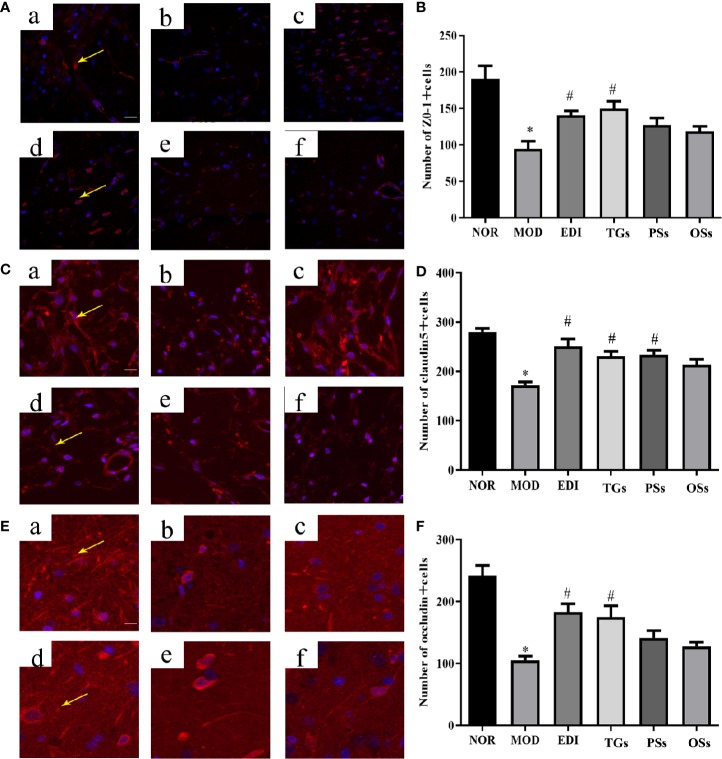
TGs increase expression of tight junction proteins in MCAO/R rats. Representative images obtained from the cortex penumbra of ischemic hemispheres. (A, C, E) Protein expression levels of ZO-1, claudin5, and occludin were measured by immunofluorescence, respectively. (B, D, F) Statistical analysis of the numbers of ZO-1, claudin5, and occludin positive cells, respectively. a–f are NOR, MOD, EDI, TGs, PSs and OSs groups, respectively. *P < 0.05 vs NOR, # P < 0.05 vs MOD. Scale bar = 50 μm.

