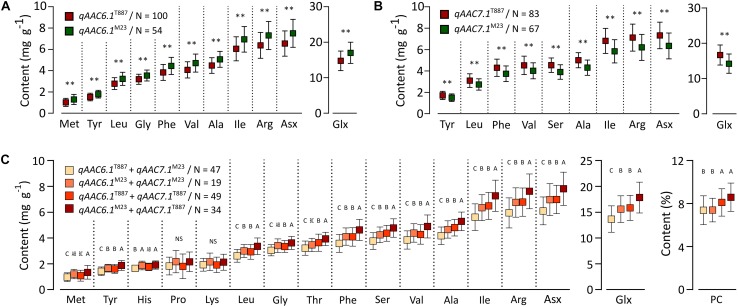
FIGURE 3.
Allelic effects for AACs in 155 RILs. Allelic effects of qAAC6.1 (A) and qAAC7.1 (B). Asterisk represents statistically significant difference (**p ≤ 0.01). Red box and green box represent the average AAC of each line containing the alleles originated from T887 and M23, respectively. (C) Effect of different allelic combination of qAAC6.1 and qAAC7.1. Different letters indicate significant differences between groups (p ≤ 0.05, Tukey’s HSD test). N, the number of lines.

