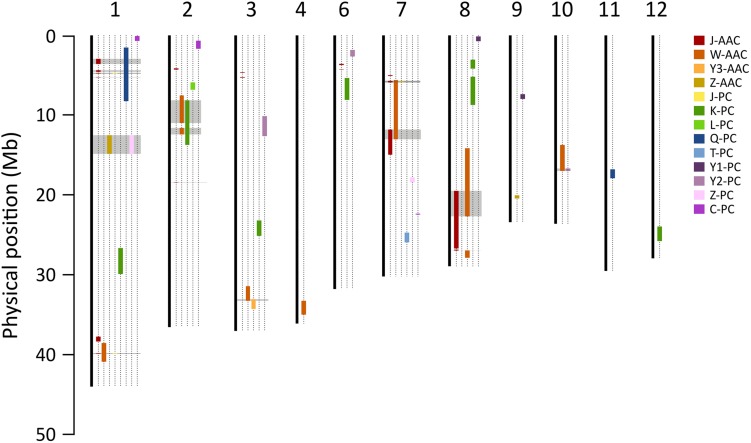
FIGURE 6.
Comparison of QTLs for PC and AAC in the present and previous studies. Color bars on chromosomes represent QTL regions for AAC and PC reported by the present and previous studies. Gray blocks indicate the loci where two more QTLs were co-located. Each prefix of trait indicates the previous study (J, this study; C, Chattopadhyay et al., 2019; K, Kinoshita et al., 2017; L, Lou et al., 2009; Q, Qin et al., 2009; T, Tan et al., 2001; W, Wang et al., 2007; Y1, Yun et al., 2014; Y2, Yu et al., 2009; Y3, Yoo, 2017; Z, Zhong et al., 2011).

