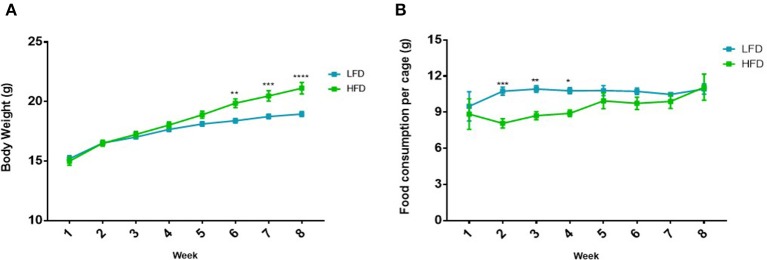
Figure 2.
Difference in (A) body weight and (B) food consumption in mice (n = 5 per cage) on the LFD and HFD for 8 weeks. Results are presented as mean ± SEM (n = 20 per group). T-tests were used for comparison between the LFD and the HFD mice for all weeks and p < 0.05 was considered as statistically significant. *p < 0.05, **p < 0.01, ***p < 0.001 and ****p < 0.0001.

