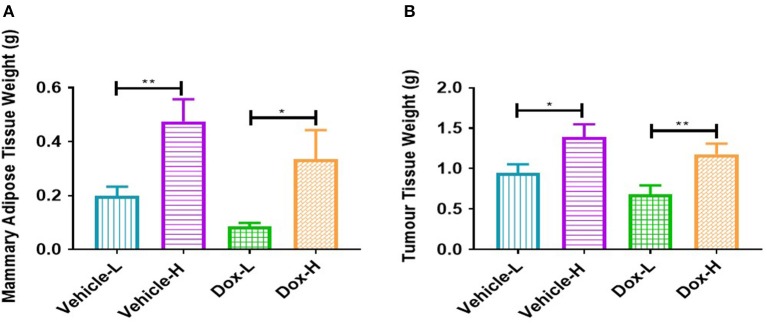
Figure 4.
Differences in (A) mammary adipose tissue weight, and (B) tumor weight of vehicle- and doxorubicin-treated groups on LFD control compared to HFD. Results are presented as mean ± SEM (n = 9–10 per group). Two-way ANOVA with Fisher's LSD post hoc correction were applied. *p < 0.05, **p < 0.01.

