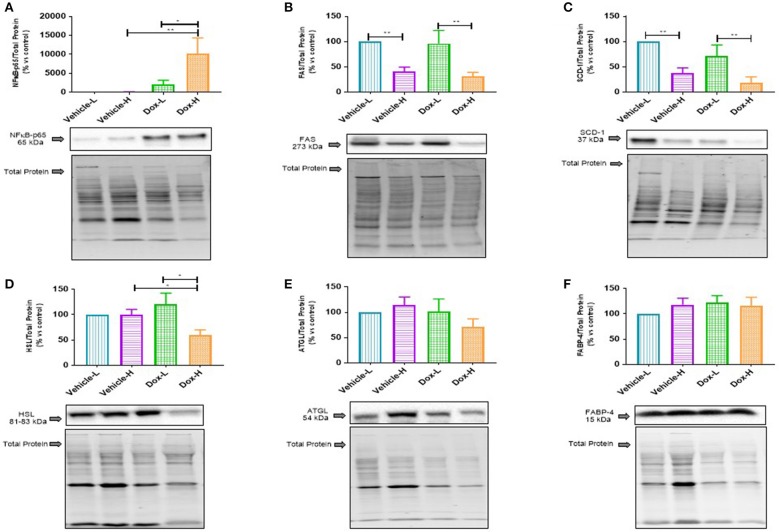
Figure 7.
Western blot analysis of lipid metabolism marker protein expression in mammary adipose tissue of vehicle control and doxorubicin treatment groups on LFD and HFD; (A) NFκB-p65, (B) FAS, (C) SCD-1, (D) HSL, (E) ATGL, and (F) FABP4. Results are presented as mean ± SEM (n = 6–8). Two-way ANOVA with Fisher's LSD post hoc correction was employed and p < 0.05 was considered as statistically significant. *p < 0.05, **p < 0.01.

