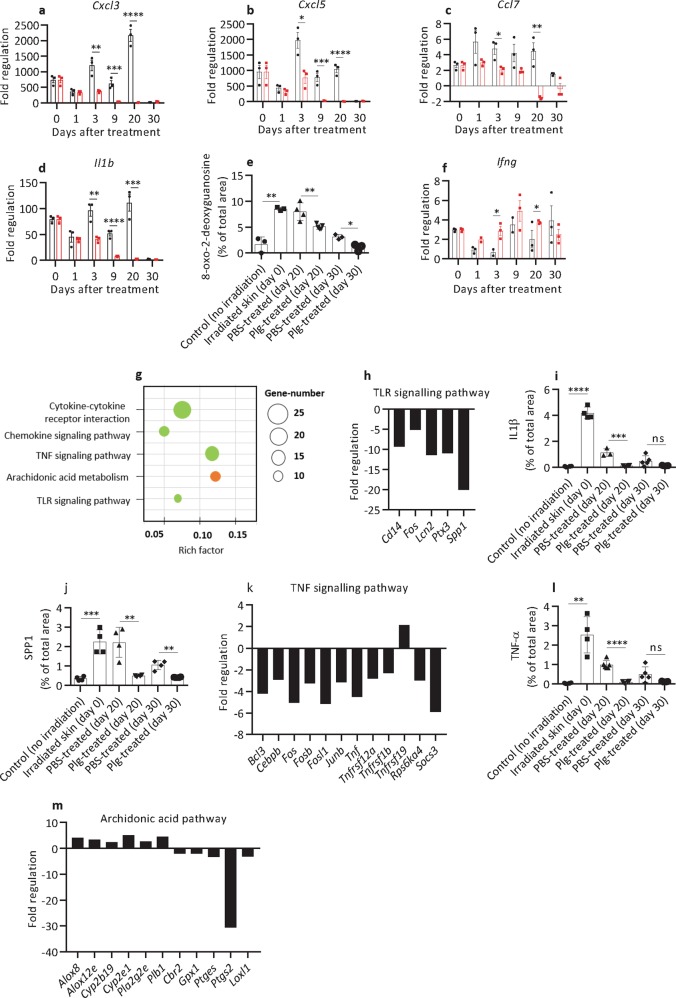
Fig. 3. Plasminogen treatment of radiation wounds results in the decreased expression of genes involved in inflammation.
a–d, f Expression of selected inflammatory genes (as indicated) in radiation wounds before treatment (day 0) (n = 3) and at different time points of PBS (black) (n = 3) or plasminogen (red) (n = 3) treatment as measured with the Mouse Wound Healing RT2 Profiler PCR array. The mRNA levels for all samples are presented as fold regulations relative to the mRNA levels in the control healthy, nonirradiated skin. (e) Quantification of 8-oxo-2-deoxyguanidine in healthy non-radiated skin (n = 3), radiated skin before treatment (day 0) (n = 3), and in PBS- (n ≥ 3) and plasminogen-treated (n ≥ 3) radiation wounds at days 20 and 30. g The KEGG enrichment scatter plot of inflammatory genes/pathways that were differentially expressed in plasminogen-treated wounds at day 20 when compared with PBS-treated wounds, as identified using mRNA sequencing. Downregulated pathways are shown in green, and the pathway that includes both upregulated and downregulated genes is shown in orange. h Expression of genes in the TLR pathway that were significantly changed at day 20 of plasminogen treatment when compared with PBS treatment, as measured using mRNA sequencing. i, j Quantification of protein levels for IL1-β and Spp1 (respectively) in healthy non-radiated skin, irradiated skin before treatment (day 0), and in PBS- and plasminogen-treated radiation wounds, based on immunostaining of paraffin sections (n ≥ 3). k Expression of genes in the TNF pathway that were significantly changed at day 20 of plasminogen treatment when compared with PBS treatment, as measured using mRNA sequencing. l Quantification of TNF-α protein levels as described in panel i (n ≥ 3). m Expression of genes in the arachidonic acid pathways that were significantly changed at day 20 of plasminogen treatment when compared with PBS treatment, as measured using mRNA sequencing. *P < 0.05; **P < 0.01; ***P < 0.005; ****P < 0.001. Rich factor is the ratio of the number of target genes divided by the number of all the genes in each pathway.

