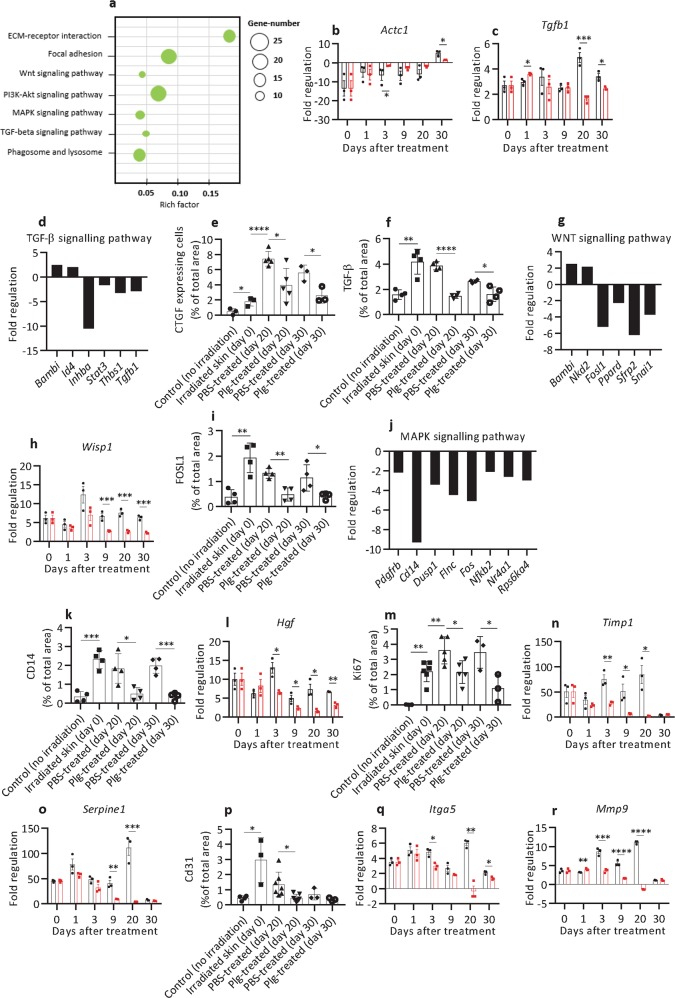
Fig. 4. Plasminogen treatment regulates the expression of genes responsible for the formation and remodeling of granulation tissue.
a The KEGG enrichment scatter plot of genes involved in the formation and remodeling of granulation tissue that were significantly downregulated in plasminogen-treated wounds at day 20 when compared with PBS-treated wounds, as identified using mRNA sequencing. b, c Expression of Actc1 and Tgfb1 (respectively) in radiation wounds before treatment (day 0) (n = 3) and at different time points of PBS (black) (n = 3) or plasminogen (red) (n = 3) treatment as measured with the Mouse Wound Healing RT2 Profiler PCR array. The mRNA levels for all samples are presented as fold regulation relative to mRNA levels in the control healthy, nonirradiated skin. d The expression of genes involved in the TGF-β pathway that were significantly changed in plasminogen-treated wounds at day 20 when compared with PBS-treated wounds, as measured using mRNA sequencing. e, f Quantification of CTGF and TGF-β (respectively) protein levels in healthy non-radiated skin, in irradiated skin before treatment (day 0), and in PBS- and plasminogen-treated radiation wounds at days 20 and 30, based on immunostaining of paraffin sections from the wounded area (n ≥ 3). g Expression of genes involved in the WNT pathway measured as described in panel d. h Expression of Wisp1 in radiation wounds shown as described in panel b. i Quantification of FOSL1 protein levels as described in panel e (n ≥ 3). j Fold regulation of MAPK pathway-related genes that were significantly enriched at day 20 of plasminogen- compared with PBS treatment. k Quantification of CD14 protein levels as described in panel e (n ≥ 3). l Expression of Hgf in radiation wounds measured as described in panel b. m Quantification of Ki67 protein levels as described in panel e (n ≥ 3). n, o Expression of Timp1 and Serpine1 in radiation wounds, respectively, shown as described in panel b. p Quantification of CD31 protein levels as described in panel e (n ≥ 3). q, r Expression of Itga5 and Mmp9 (respectively) in radiation wounds, shown as described in panel b. *P < 0.05; **P < 0.01; ***P < 0.005; ****P < 0.001. Rich factor is the ratio of the number of target genes divided by the number of all the genes in each pathway.

