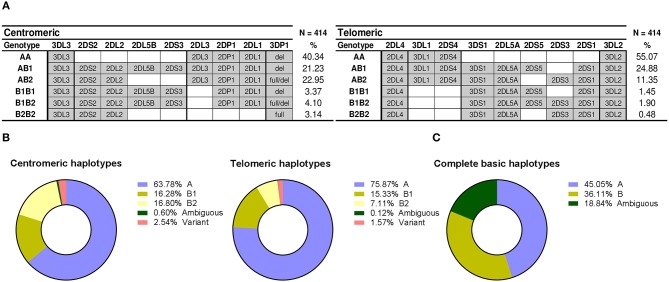
Figure 4.
Distribution of centromeric and telomeric gene profiles and haplotypes. (A) Centromeric and telomeric profiles corresponding to combinations of conventional haplotypes are represented as in Figure 2. Profiles derived from variant and novel arrangements are not represent, therefore frequencies do not sum up 100%. (B) Distribution of partial KIR haplotypes. (C) Frequencies of complete haplotypes and phasing ambiguities.

