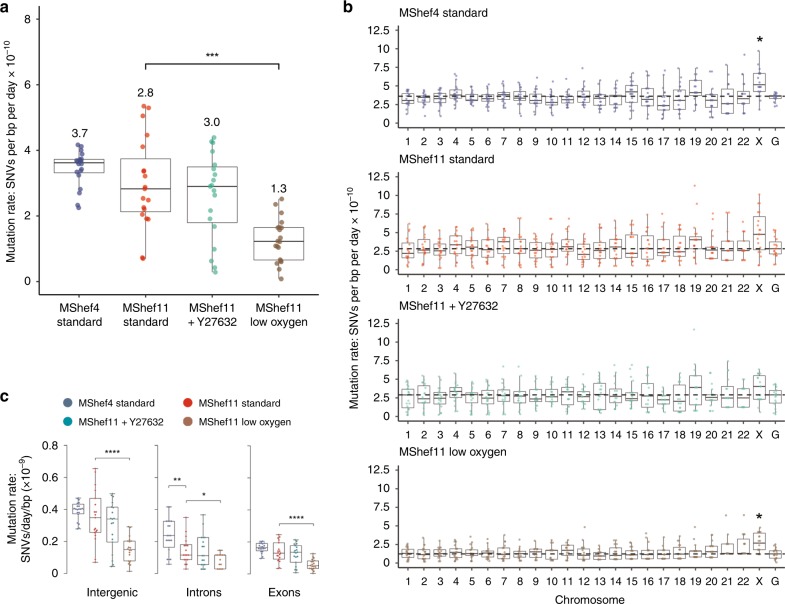
Fig. 2. Mutation rate and genomic distribution of single-nucleotide variant mutations in different growth-conditions.
Box and whisker plots showing haploid mutation rates and genomic distribution of single-nucleotide variant mutations in subclones of MShef4 (N = 20) and MShef11 (N = 19) grown under standard conditions, and subclones of MShef11 cultured with the rho-kinase inhibitor Y27632 at passage (N = 20) or cultured in low oxygen (N = 21). Boxes represent 25th–75th percentiles; whiskers show the min and max ranges; horizontal lines indicate the median values. a The median mutation rates (shown below each plot) for MShef4 and MShef11, cultured in standard conditions, and MShef11 cultured with the rho-kinase inhibitor Y27632 were not significantly different. However, MShef11 cultured in low oxygen exhibited a ~54% lower mutation rate (unpaired two-tailed t-tests with Welch’s correction; P = < 0.0001). ns: P > 0.05; *P ≤ 0.05; **P ≤ 0.01, ***P ≤ 0.001; ****P ≤ 0.0001. b Across all chromosomes only the X-chromosome mutation rate deviated from the genome-wide rates, being elevated in all growth conditions, although only significant in MShef4 and MShef11 under low oxygen, assessed by independent pairwise two-tailed Mann-Whitney tests comparing the median genome-wide rate in each condition with that of each chromosome (Bonferroni-adjusted P = < 0.007; P = < 0.034). When data from all growth conditions were combined, the elevated X-chromosome mutation rate remained significant (P = < 0.05). ns: P > 0.05; *P ≤ 0.05; **P ≤ 0.01, ***P ≤ 0.001; ****P ≤ 0.0001. c Across coding and non-coding regions, normalised to the genomic DNA content of each class of region, under each growth-condition intergenic DNA showed higher mutation rates than exons and introns. For intergenic DNA: MShef11 standard vs MShef11 low oxygen P < 0.001; For intronic DNA: MShef4 standard vs. MShef11 standard P = 0.004, MShef11 standard vs MShef11 low oxygen P = 0.017; For exonic DNA: MShef11 standard vs MShef11 low oxygen P < 0.0001. Asterisks indicate level of significance between groups assessed by independent pairwise two-tailed Mann-Whitney testing. ns: P > 0.05; *P ≤ 0.05; **P ≤ 0.01, ***P ≤ 0.001; ****P ≤ 0.0001. Source data are provided in Supplementary Data 1.

