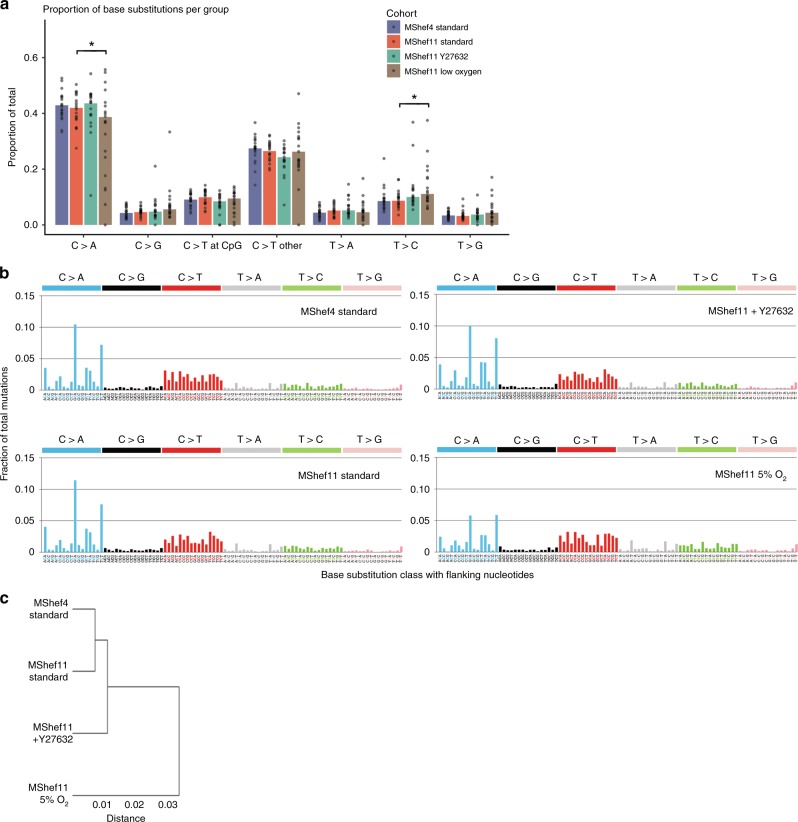
Fig. 3. Pattern of base substitutions and mutation signatures.
a Bar and dot chart showing low-resolution mutational spectra and proportions of each of seven point mutation classes detected in MShef4 standard (N = 20), MShef11 standard (N = 19), MShef11 + Y27632 (N = 20), and MShef11 low oxygen (N = 21) subclones. Bars indicate the mean proportion of each class of mutation for each cell line/growth-condition group; dots indicate individual subclones in each group. C > A transversions and C > T transitions are most prevalent in the data. A two-tailed t-test showed MShef11 cultured in low oxygen to have a significant reduction in C > A transversions compared to standard conditions (P = 0.037) whilst Wilcoxon testing also showed a small increase in T > C transitions (P = 0.045). b High-resolution mutational spectra derived from the combined mutation data all subclones grown in each growth-condition. Each of the six possible point mutations is subdivided into 16 classes on the basis of the 5’ and 3’ nucleotides flanking the mutation, resulting in 96 possible substitution classes. C:G > A:T and C:G > T:A mutations are most prevalent in the data. These spectra can be correlated with 30 mutation signatures annotated in the Catalogue of Somatic Substitutions in Cancer (COSMIC) database53 to explore the aetiology of mutation. c Dendrogram showing the similarity of all growth-condition groups based on their mutational profiles. MShef4 and MShef11 cultured in standard conditions exhibited the most similar mutational profiles, whereas the low oxygen condition is the most dissimilar in mutation profile compared to all other groups. Source data are provided in Supplementary Data 2.

