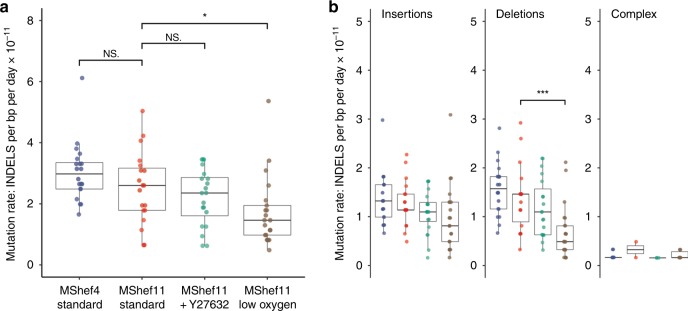
Fig. 4. Mutation rate and genomic distribution of insertion and deletion mutations in different growth-conditions.
a Box and whisker plots showing haploid mutation rates all INDELs in subclones derived from clones grown in different conditions. MShef11 subclones derived from low oxygen (N = 21) showed a significantly reduced INDEL mutation rate compared to subclones from standard conditions (N = 19) (assessed by unpaired two-tailed t-test with Welch’s correction; P = < 0.02). Taken together, the mutation rates of INDELs were approximately 10-fold lower than the mutation rates of single-nucleotide variants. Boxes represent the 25th–75th percentiles of the data; whiskers show the min and max range of the data; horizontal lines indicate the median value. ns: P > 0.05; *P ≤ 0.05; **P ≤ 0.01, ***P ≤ 0.001; ****P ≤ 0.0001. b Box and whisker plots showing haploid mutation rates of insertion, deletion and complex (mixed insertion and deletion) mutations in cells grown in different conditions. MShef11 subclones derived from low oxygen (N = 21) showed a significantly reduced number of deletions compared to those from standard conditions (N = 19) (assessed by unpaired two-tailed t-tests with Welch’s correction; P = < 0.0008). The mutation rates of complex INDELs (mixed insertion and deletion) were 10-20X lower than the rates of insertions or deletions across all cell lines and growth conditions. Boxes represent the 25th–75th percentiles of the data; whiskers show the min and max range of the data; horizontal lines indicate the median value. ns: P > 0.05; *P ≤ 0.05; **P ≤ 0.01, ***P ≤ 0.001; ****P ≤ 0.0001. Source data are provided in Supplementary Data 3.

