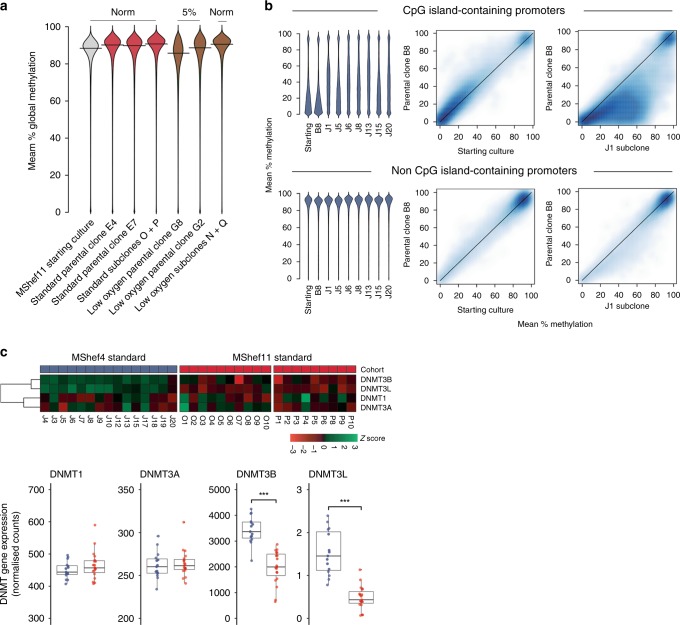
Fig. 6. Epigenetic changes.
a Beanplots showing global DNA methylation levels of MShef11 starting cultures, parental clones grown in standard or low oxygen conditions, and the subclones derived from those conditions. Methylation was assessed over tiled probes across the genome, each containing 100 CpGs. Both parental clones grown in low oxygen show a small decrease in methylation, particularly clone G8. This decrease in methylation was reversible, as subclones derived from low oxygen revert to normal methylation levels following expansion in standard conditions. Source data are provided in Supplementary Data 6. b DNA methylation of promoters in MShef4 subclones (N = 20). Promoter regions were defined as regions surrounding transcription start sites, with 1500 kb upstream and 500 kb downstream context. Beanplots (left panels) show DNA methylation levels of promoters with and without CpG islands, in a randomly selected subset of MShef4 J subclones. For both classes of promoter, the starting culture and the parental clone, B8, derived from that starting culture had comparable methylation levels, whereas each J subclone showed hypermethylation of a subset of CpG island-containing promoters compared to its parental clone, B8. Density scatter plots (right panels) show the distribution of promoter methylation levels between the MShef4 starting culture and its derived parental clone, B8, and between the parental clone B8 and an example subclone, J1. The density scatter plots show comparable levels of non-CpG island-promoter methylation between starting culture material and parental clone B8, but hypermethylation of CpG island-containing promoters in subclone J1 compared to parental clone B8. Source data are provided in Supplementary Data 9–12. c Top panel; heatmap showing the relative expression of de novo methyltransferase (DNMT) genes in MShef4 (N = 20) and MShef11 (N = 19) subclones from standard conditions. Lower panel; box and whisker plots showing the normalised expression counts (fragments per million reads) for DNMT genes in MShef4 and MShef11 standard subclones. Both DNMT3B and DNMT3L are more highly expressed in MShef4 subclones (P = 7.2−8 and P = 2−8). Boxes represent the 25th–75th percentiles of the data; whiskers show the min and max range of the data; horizontal lines indicate the median value. ns: P > 0.05; *P ≤ 0.05; **P ≤ 0.01, ***P ≤ 0.001; ****P ≤ 0.0001. Source data are provided in Supplementary Data 13.

