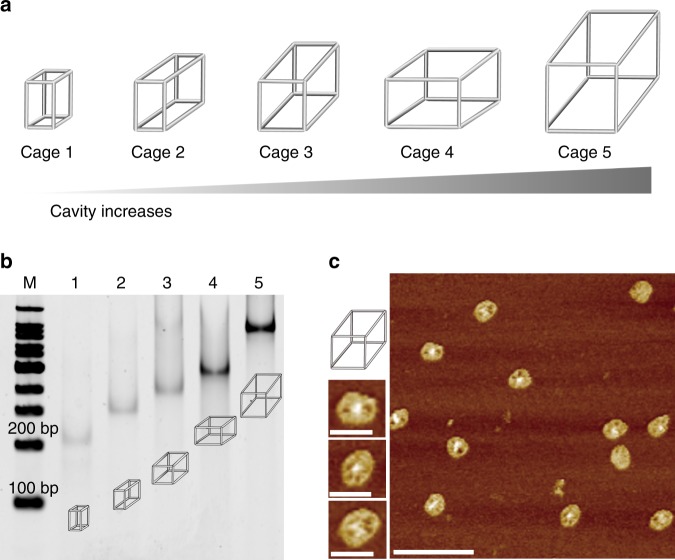
Fig. 3. Design and characterization of DNA nanocages with different cavity sizes.
a Schematic illustration of DNA nanocages construction. The cavity of DNA nanocages gradually increases from cage 1 to cage 5. b N-PAGE characterization of DNA nanocages from cage 1 (lane 1) to cage 5 (lane 5). c Atomic force microscopy characterization of DNA nanocages (Cage 5). The scale bars are 100 and 30 nm in large and small imaging, respectively. Source data are provided as a Source Data file.

