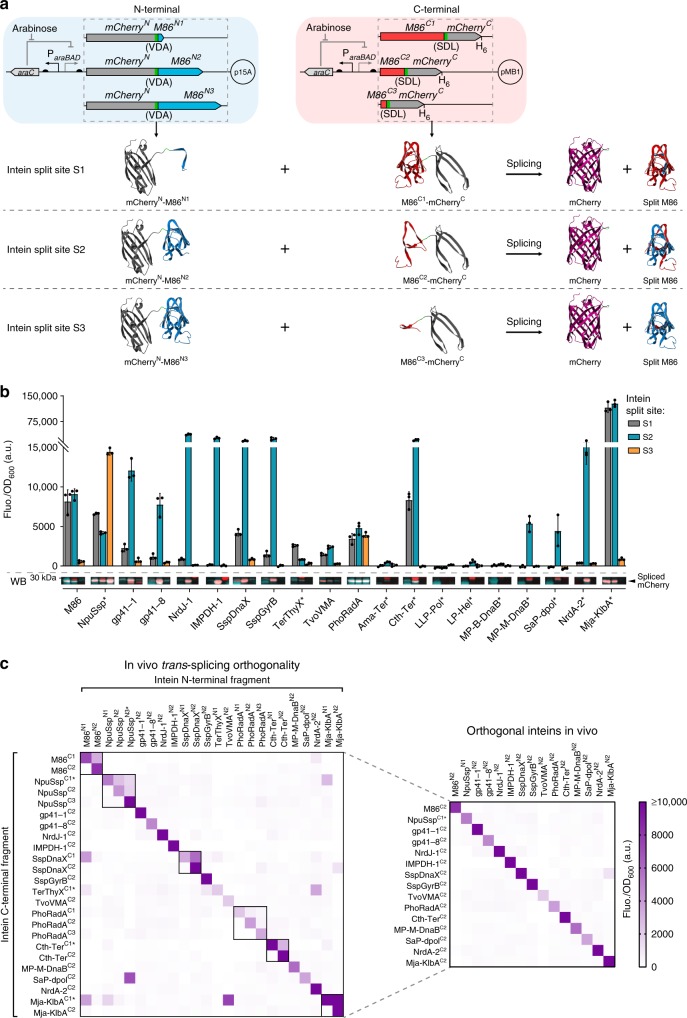
Fig. 2. In vivo trans-splicing of inteins split at different sites and orthogonality characterization.
a Genetic circuits for the arabinose-induced expression of split mCherry-split intein N- and C-terminal chimeric proteins from two different plasmids (top) and schematics of protein trans-splicing, exemplified using M86 intein (bottom). The three intein split sites are depicted: S1 at the N-terminus, S2 at the canonical endonuclease insertion site and S3 at the C-terminus. Promoters are represented by straight angle arrows and RBS by black semi-circles. Split mCherry halves are shown in gray, M86 intein N-terminal in blue, M86 intein C-terminal in red, added junction sequence residues (VDA and SDL) in green and the spliced mCherry in purple. b Background subtracted fluorescence (Fluo.) of E. coli cells expressing chimeric protein halves containing counterpart inteins split at the three different sites (S1, S2, and S3), normalized to the cell density (OD600). Bars represent the mean of three biological replicates (n = 3) and error bars correspond to s.d. The Western blot image (WB, bottom) shows the region corresponding to the spliced mCherry (Western blot full images can be found in Supplementary Fig. 7). The red signal corresponds to the antibody recognizing the N-terminal of mCherry and the turquoise signal corresponds to the antibody recognizing the hexahistidine tag (H6) at the C-terminus. The overlap of both signals (white) corresponds to the spliced reporter proteins. c Characterization of a 24 × 24 orthogonality matrix of the different split inteins (left). On the right, a pruned matrix showing the mutually orthogonal set of split inteins is depicted. Color gradient represents the background subtracted fluorescence (Fluo.) of E. coli cells expressing the split mCherry-split intein N- and C-terminal chimeric proteins, normalized to the cell density (OD600). Elements of the same intein split at different sites are boxed within the matrix. Fluo./OD600 values for each combination are shown in Supplementary Data 1. Data represents mean values of three biological replicates (n = 3). * Inteins with a flexible linker at the canonical split site. Source data are provided as a Source Data file.

