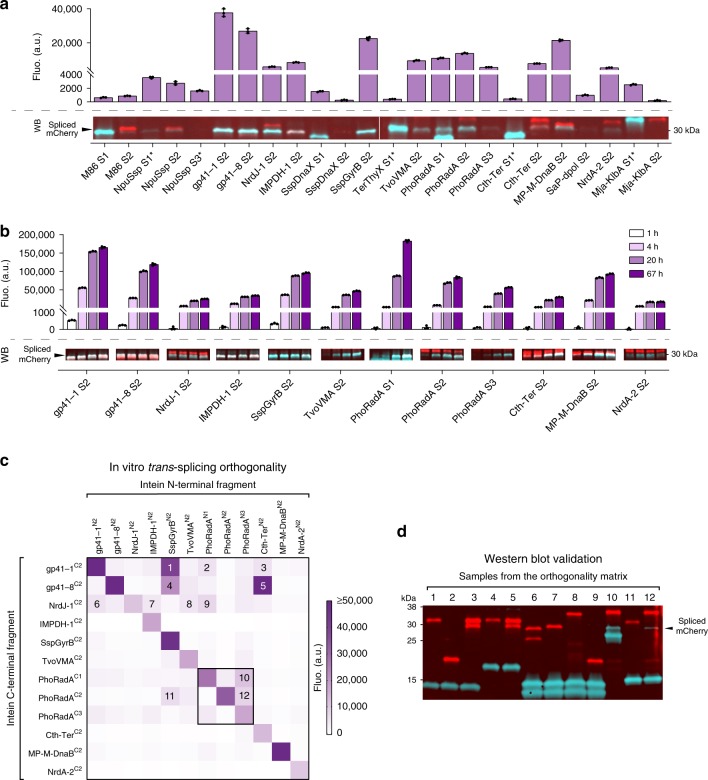
Fig. 3. In vitro trans-splicing of split inteins and orthogonality characterization.
a End-point fluorescence (Fluo., top) and Western blot analysis (WB, bottom) of the in vitro trans-splicing reactions carried out for 20 h, with mixed lysates of E. coli cells expressing complementary split mCherry-intein chimeric proteins (over time measurements can be found in Supplementary Fig. 13 and full WB image can be found in Supplementary Fig. 14). * Inteins with a flexible linker at the canonical split site. b Fluorescence (Fluo., top) and Western blot analysis (WB, bottom) of the in vitro trans-splicing reactions carried out with the most active split intein pairs as observed in a. Fluorescence was monitored for 67 h and measurements for 1, 4, 20, and 67 h of incubation are shown; samples for WBs were collected at the same time points (over time measurements can be found in Supplementary Fig. 15 and full WB images can be found in Supplementary Fig. 16). Bars in a and b represent the mean of three independent replicates (n = 3) and error bars correspond to s.d. c Characterization of a 12 × 12 orthogonality matrix of the most active split intein pairs. Color gradient represents the end-point fluorescence (Fluo.) of the in vitro trans-splicing reactions carried for 20 h. Elements of the same intein split at different sites are boxed within the matrix and the numbers correspond to samples with unexpectedly high fluorescence that were collected for further splicing evaluation. Fluo. values for each combination represent the mean values of three independent replicates (n = 3) and are shown in Supplementary Data 2. d Western blot validation of splicing for samples exhibiting unexpectedly high fluorescence. Lane numbers correspond to the elements numbered within the orthogonality matrix c. For all Western blots, the red signal corresponds to the antibody recognizing the N-terminal of mCherry and the turquoise signal corresponds to the antibody recognizing the hexahistidine tag (H6) at the C-terminus. The overlap of both signals (white) corresponds to the spliced reporter proteins. The proteins’ theoretical molecular weights can be found in Supplementary Table 9. Source data are provided as a Source Data file.

