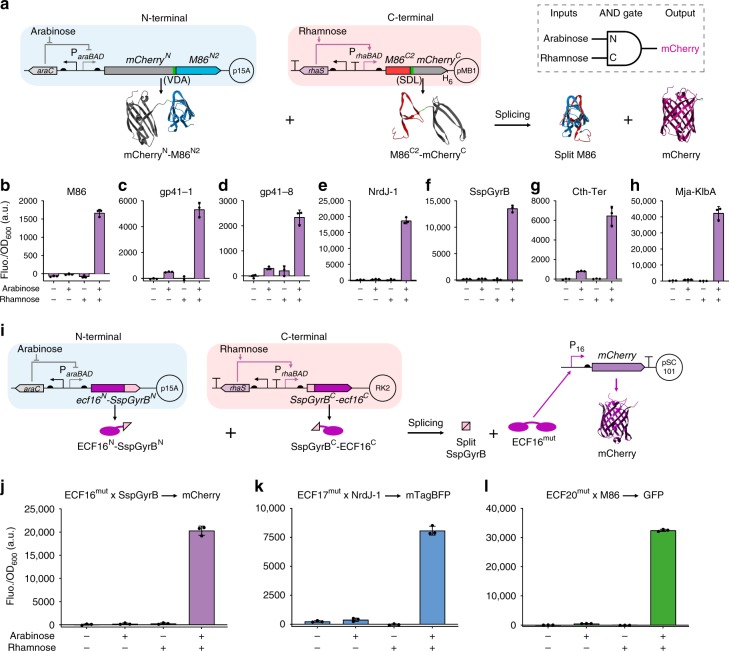
Fig. 4. Design and characterization of split intein-enabled logic AND gates.
a Genetic circuits for the arabinose- and rhamnose-induced expression of split mCherry-intein N- and C-terminal chimeric proteins, respectively, from two different plasmids (top, left), and schematics of protein trans-splicing, exemplified using M86 split at site S2 (bottom). The AND gate behavior (top, right) is achieved only when both inducers are present. Promoters are represented by straight angle arrows and RBS by black semi-circles. Split mCherry halves are shown in gray, M86 intein N-terminal in blue, M86 intein C-terminal in red, the added junction sequence residues (VDA and SDL) in green and the spliced mCherry in purple. b–h Background subtracted fluorescence (Fluo.) of E. coli cells harboring the genetic circuits for split mCherry-intein chimeric proteins, in the absence (−) or presence (+) of inducers. i Genetic circuits for the arabinose- and rhamnose-induced expression of split ECFmut-split intein N- and C-terminal chimeric proteins, respectively, from two different plasmids (top, left), and schematics of protein trans-splicing, exemplified using ECF16mut and the SspGyrB intein (bottom). Split ECF16mut halves are shown in dark pink and SspGyrB halves in light pink. After splicing, the reconstituted ECF16mut can activate its cognate promoter (P16) and the fluorescent reporter is expressed. j–l Background subtracted fluorescence (Fluo.) of E. coli cells harboring the genetic circuits for the expression of the chimeric split ECF16mut × SspGyrB halves and expression of the mCherry reporter from P16 (j), the chimeric split ECF17mut × NrdJ-1 and expression of the mTagBFP reporter from P17 (k) or the chimeric split ECF20mut × M86 and expression of the GFP reporter from P20 (l), in the absence (−) or presence (+) of inducers. In all the cases, fluorescence was measured 6 h after induction and it was normalized to the cell density (OD600). Bars in b–h and j–l represent the mean of three biological replicates (n = 3) and error bars correspond to s.d. Source data are provided as a Source Data file.

