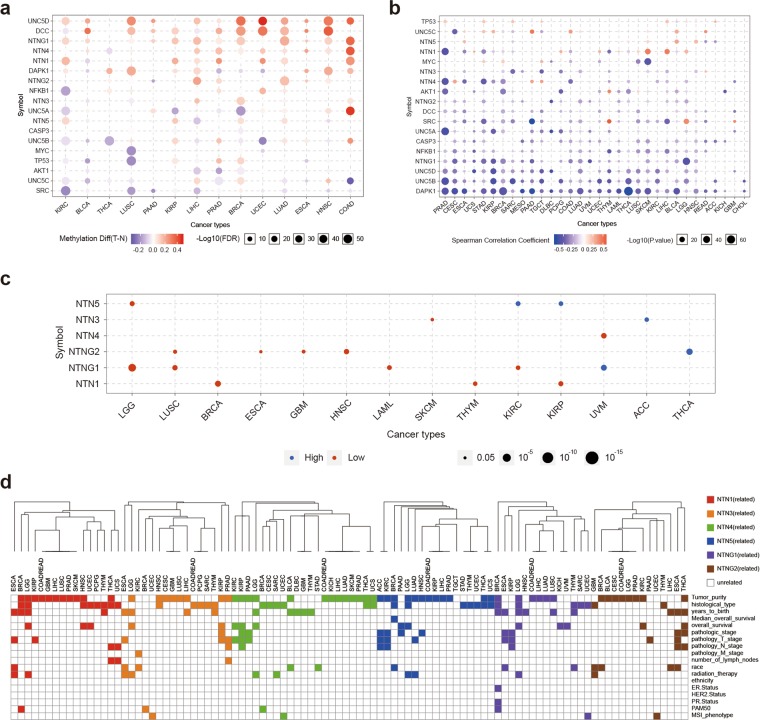
Figure 5.
Netrins methylation and distribution in clinical samples. (a) Bubble map of the differential methylation of netrins and downstream genes between TCGA cancer and normal samples. Blue dots represent methylation down-regulation in tumors, and red dots represent methylation up-regulation in tumors, with the darker the color, the greater the difference. The size of the point represents statistical significance, where the larger the size, the greater the significance. (b) Correlation between methylation and netrin expression and downstream genes in TCGA cancer. Blue dots indicates gene methylation level is up-regulated and gene expression is down-regulated. Red dots indicate that gene methylation level and gene expression are up-regulated. The darker the color, the higher the correlation. The size of the point represents the statistical significance, where the larger the size, the greater the significance. (c) Differential survival of high and low methylation of netrins in TCGA cancer. Only genes with p value < 0.05 are displayed on the diagram. Red dots represent worse survival of hypermethylation in tumors, and blue dots indicate the opposite. The size of the point represents the statistical significance, where the larger the size, the greater the significance. (d) Relationship between netrin methylation and clinical parameters in TCGA cancers. Color indicates that clinical parameters are associated with methylation (p < 0.05), and white indicates no association.

