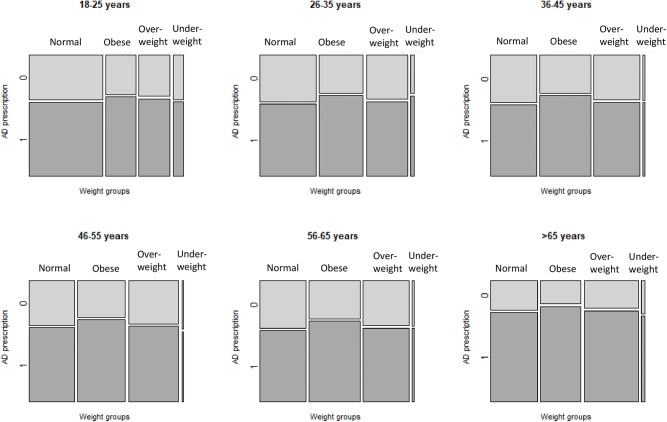
Figure 3.
Prevalence of AD prescribing, according to weight category and age group. AD, antidepressant medications. Each mosaic plot represents an age group. The bars (Normal, Obese, Overweight, Underweight) represent weight categories; thickness of the bars represent a proportion of patients in each weight category. Dark tiles represent proportions of patients with AD prescriptions (“1”), light tiles—proportions of patients without AD prescriptions (“0”) in each weight category.

