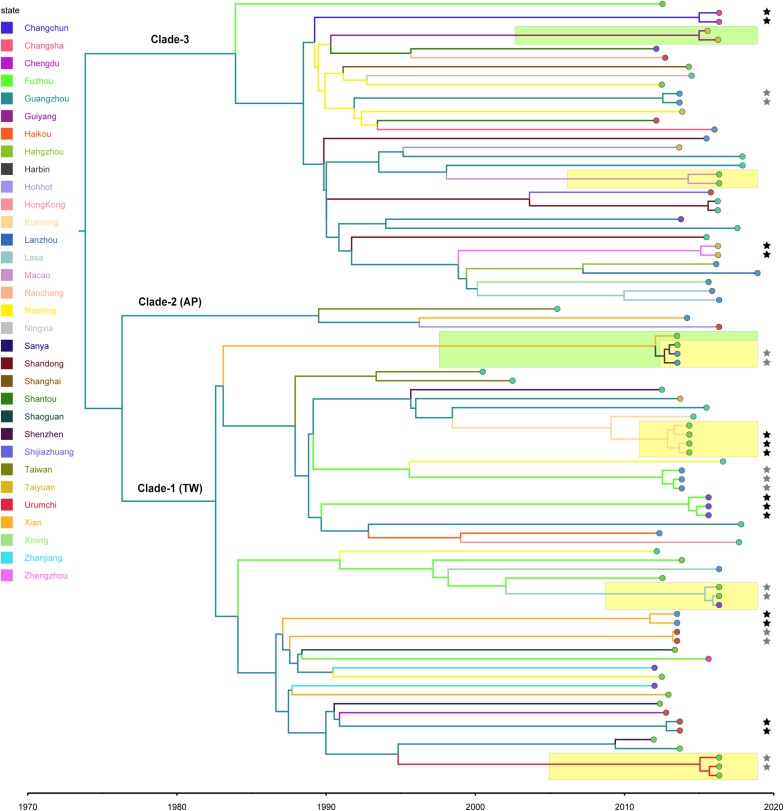
FIGURE 2.
Bayesian maximum clade credibility tree of CC59 isolates. Branch colors represent the region of origin of each sample and their most recent common ancestor, respectively. The color of the circle at the end of each branch indicates the isolate’s source; cyan represents isolation from a human, green from an aquatic source, blue from retail meat, gold from an RTE food, red from a quick-frozen product, purple from an edible mushroom, and orange from a vegetable. Isolates that were source from the same food sample are marked up with colored stars behind the tree tips. Clades that were estimated to have been involved in recent local transmission are highlighted with yellow squares, and those estimated to have been involved in recent cross-country transmission are highlighted with green squares.

