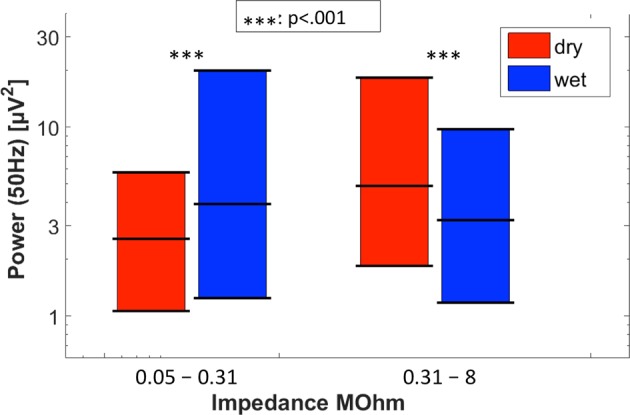
Figure 8.

Spectral power around 50 Hz for the dry (red) and wet (blue) EEG systems. Left two bars: 25-/50-/75-percentiles observed during dry and wet electrode recordings at those electrode locations of all subjects where the dry electrode impedances were below the median (0.31 MOhm). Asterisk denotes significant difference between wet and dry EEG systems. Right two bars: Same as above, for impedances above the median. Asterisk denotes significant difference between wet and dry EEG systems.
