Figure 6.
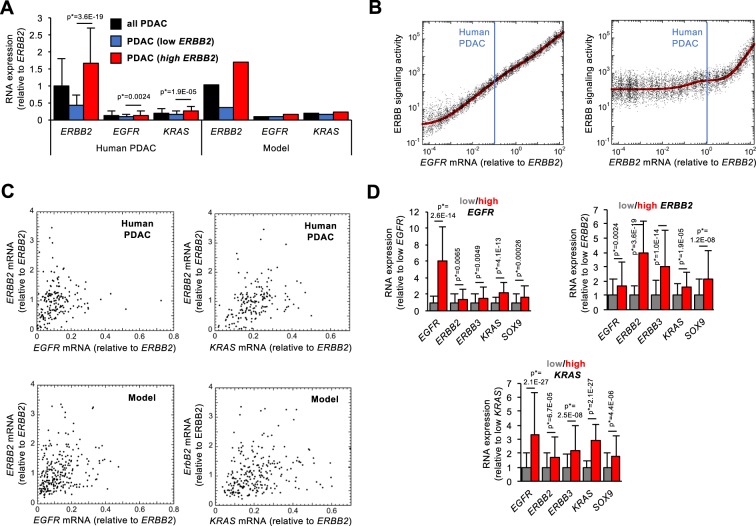
Impact of EGFR and ERBB2 expression on ERBB signaling activity in human PDAC. (A) Left: RNA expression of EGFR, ERBB2 and KRAS in all PDAC from TCGA (black bars, n = 178), in tumors with lowest (n = 50, blue bars) or highest (n = 50, red bars) ERBB2 expression. Right: Calibration of the mathematical model on the RNA expression levels available in TCGA. mRNA expression levels were normalized to the mean expression level of ERBB2 mRNA in all PDAC. (B) Modeling the predicted impact of EGFR and ERBB2 expression levels on ERBB signaling activity in human PDAC (red curves). Each black dot is a PDAC patient of a heterogeneous population where 50% of uniform random variations are considered around the basal value of each parameter. Vertical blue lines correspond to the expression levels of EGFR and ERBB2 (relative to the mean ERBB2 expression in all tumors). For (A,B), parameter values are described in Supplementary Information. (C) Expression levels of ERBB2 as a function of EGFR (left) or KRAS (right) in all human PDAC (upper panels, n = 178) and in the mathematical model for a heterogeneous population of 250 PDAC patients with 50% of random uniform variations of parameter values (bottom panels). (D) RNA expression levels in tumors with lowest (n = 50, grey bars) or highest (n = 50, red bars) expression of EGFR (left), ERBB2 (middle) or KRAS (right). Data are means +/− SD. p* values were adjusted with Benjamini-Hochberg corrections considering the entire transcriptome.

