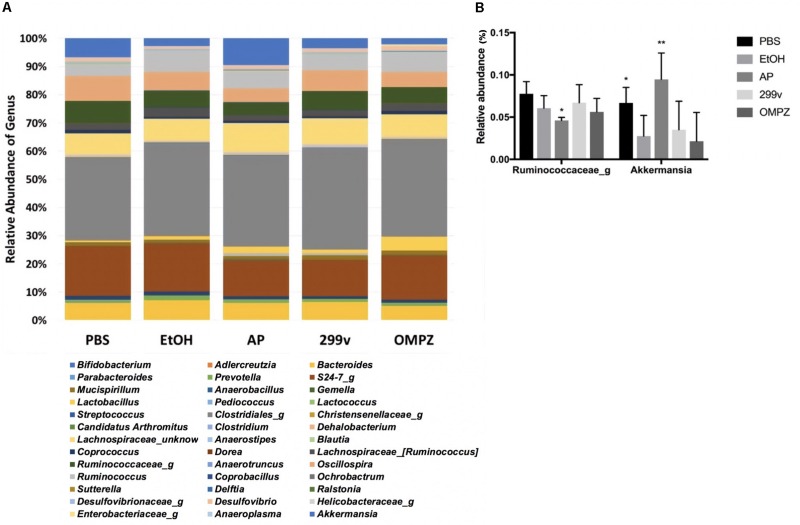
FIGURE 5.
Taxonomic analysis of cecal microbiota from ethanol treated mice: (A) relative abundance of the genus level taxonomic composition, and (B) relative abundance of the genera Akkermansia and Ruminococcus. PBS: non-ethanol treated group, EtOH: ethanol treated control group, OMPZ: omemprazole treated group, 299v: Lactobacillus plantarum 299v, AP: Lactobacillus plantarum APSulloc GTB1TM. Data was analyzed with one-way-ANOVA compared to EtOH *p < 0.05, **p < 0.01.

