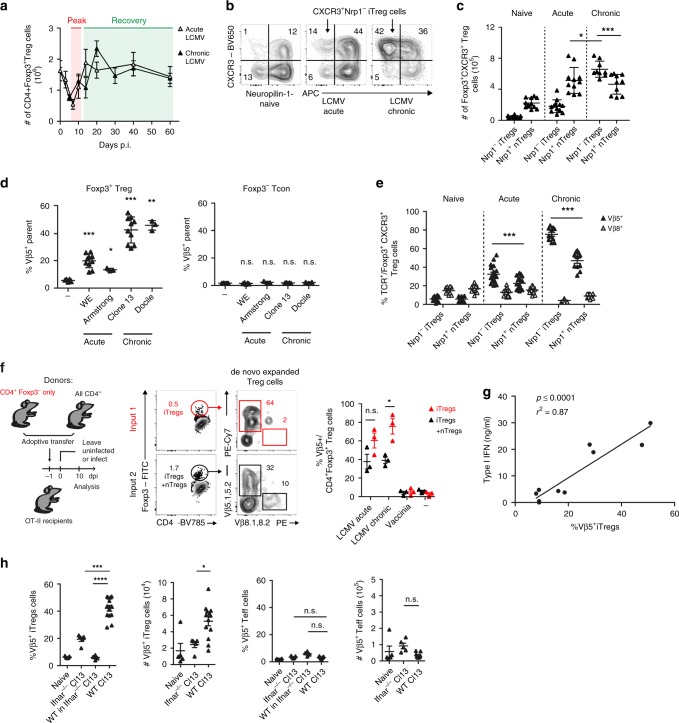
Fig. 1. Induced Treg cells compensate for Treg cell loss caused by type I interferons.
a–c WT mice were infected with 200 f.f.u. LCMV WE (acute), 106 f.f.u. LCMV clone 13 (chronic), or were left naive. a Total numbers of CD4+Foxp3+ splenic Treg cells were determined by flow cytometry throughout the course of infection (n = 3–11). Frequencies (b) and total numbers (c) of CD4+Foxp3+CXCR3+Nrp1− iTreg and CD4+Foxp3+CXCR3+Nrp1+ nTreg cells were determined in naive and LCMV-infected mice on day 14 post infection (n = 9–12). d WT mice were infected with LCMV WE (200 f.f.u.), Armstrong (106 f.f.u.), clone 13 (106 f.f.u.), or Docile (106 f.f.u.) and frequencies of CD4+Foxp3+ Treg or CD4+Foxp3− conventional T cells expressing the indicated Vβ chains were determined by flow cytometry (day 10; n = 3–10). e Frequencies of TCR Vβ5+ and Vβ8+ cells among CD4+Foxp3+CXCR3+Nrp1− iTreg and CD4+Foxp3+CXCR3+Nrp1+ nTreg cells were determined by flow cytometry as in c (day 14; n = 11–18). f Flow sorted CD45.1+CD4+Foxp3− T cells and CD90.1+CD4+ T cells were adoptively co-transferred into CD45.2+ OT-II mice. Reconsituted mice were infected the next day with LCMV WE (200 f.f.u., acute), clone 13 (106 f.f.u., chronic), or Vaccinia virus (106 f.f.u.) or were left naive. Vβ5+ frequencies among donor CD4+Foxp3+ were determined on day 10 (n = 3). g WT mice were infected with Vaccinia virus (106 f.f.u.), Vaccinia Virus + poly IC (2 × 50 μg/mouse, day 0 and 2), LCMV WE (200 f.f.u.), LCMV WE + poly IC, or LCMV clone 13 (106 f.f.u.) and type I IFN levels in the blood 24 h after infection were correlated with frequencies of Vβ5+ CD4+Foxp3+CXCR3+Nrp1− iTreg cells on day 10 post infection (n = 2 values per condition, pooled from 2–3 mice). h WT, Ifnar1−/−, or Ifnar1−/− mice that had received 106 Thy1.1+ CD4+ T cells i.v. one day before were chronically infected with 106 f.f.u. LCMV clone 13 and frequencies and total numbers of Vβ5+ CD4+Foxp3+ Treg or Vβ5+ CD4+Foxp3− conventional T cells were determined by flow cytometry (day 10; n = 4–13). In summary plots, data are shown as mean ± SD. For statistics, Mann–Whitney U (c, e) or one-way ANOVA (d, f, h) was used.

