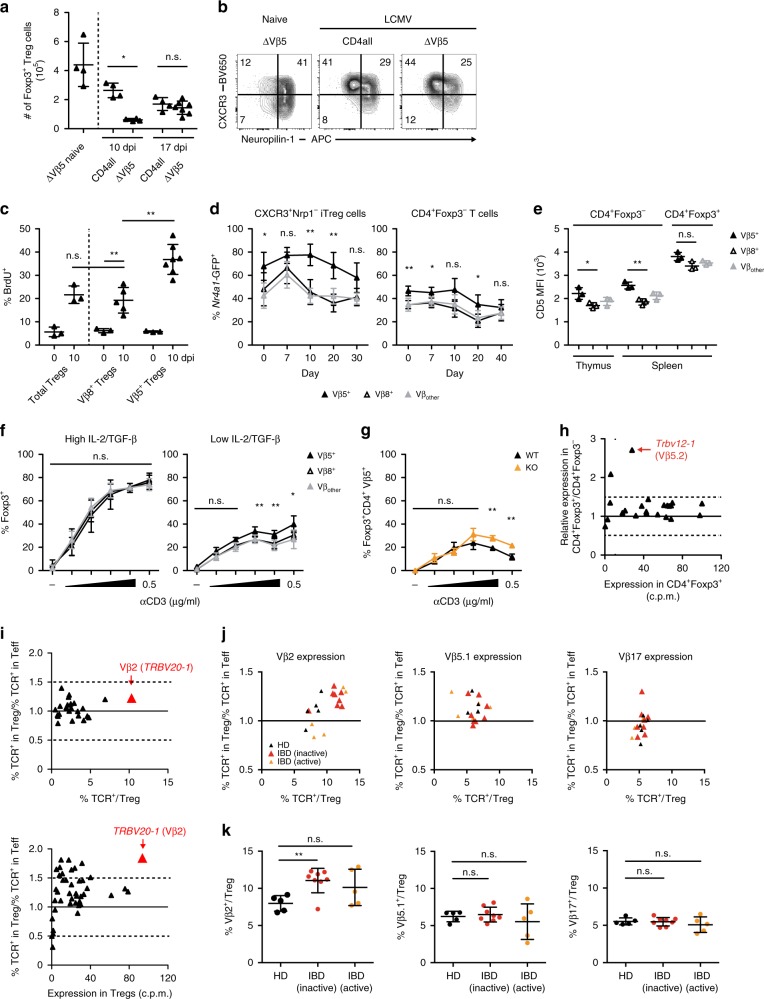
Fig. 5. CD4+Vβ5+ T cells readily convert into iTreg cells.
Tcrb−/−Tcrd−/− mice reconstituted with total or ΔVβ5 CD4+ T cells were infected with LCMV clone 13 or left naïve, and analyzed 10 or 17 days after infection. Total splenic Treg counts (a) and their expression of CXCR3 and Nrp1 (b) was determined by flow cytometry (n = 4). c BrdU incorporation in splenic Treg cell populations 10 days post infection (n = 3−7). d Nr4a1-GFP mice were infected with LCMV WE and frequencies of Nr4a1-GFP+ cells carrying the indicated TCR Vβ chain among CD4+Foxp3+CXCR3+Nrp1− iTreg (left) and CD4+Foxp3− conventional T cells (right) were determined by flow cytometry (n = 3–6). e CD5 expression in naïve thymic and splenic CD4+Foxp3− conventional T cells and splenic CD4+Foxp3+ Treg cells was determined by flow cytometry (n = 3). f Sorted CD4+CD25− T cells from naïve WT mice were co-cultured with CD11c+MHCII+ cells (1:1) with titrated amounts of anti-CD3 (1:3 dilution steps) and 0.3 or 3 ng/ml TGF-β plus 2 or 20 U/ml IL-2 (low and high, respectively). Foxp3+ frequencies among CD4+ T cells carrying the indicated TCR Vβ chain were determined by flow cytometry (n = 3). g As in f under low IL-2/TGF-β conditions with CD11c+MHCII+ cells isolated from LCMV-infected Atg5fl/flxItgaxCre/WT (KO) or Atg5fl/f (WT) mice. Frequencies of CD4+Foxp3+ Treg cells among CD4+Vβ5+ T cells (n = 3). h Transcriptional analysis of Trbv gene segments shown as relative expression against expression in CD4+Foxp3+ Treg cells. i Analysis of TCR Vβ usage in healthy donor human Treg cells displayed as in h and determined by RNA-Sequencing (bottom) and flow cytometric spectratyping (top), (n = 6). j, k Expression of Vβ2, Vβ5.1, and Vβ17 TCR chains among CD4+CD127−CD25hi Treg and CD4+CD127varCD25var effector T cells from healthy human donors (n = 5) or IBD patients with inactive (n = 8) or active (n = 5) disease was determined by flow cytometry. Data are presented as relative expression vs. expression in Treg cells (j) and as frequencies within Treg cells (k). Data are shown as mean ± SD; summary graphs display pooled data of 2–3 independent experiments. For statistics, Mann–Whitney U (a, c, e, k) or one-way ANOVA (d, f, g) was used.

