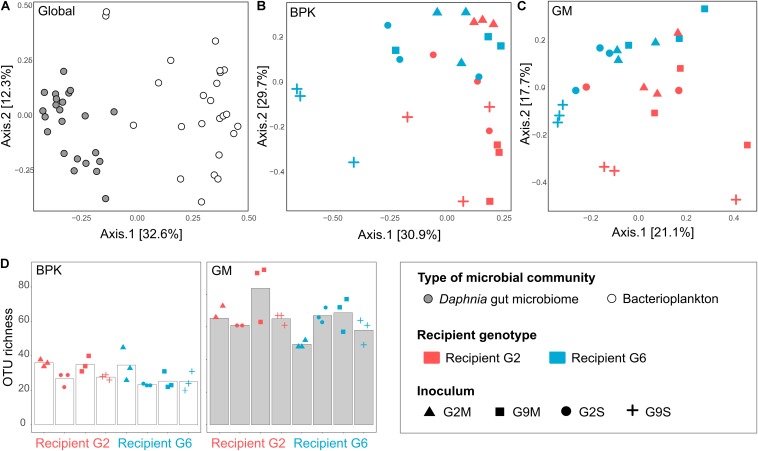
FIGURE 4.
Contribution of recipient Daphnia genotype and microbial source to BPK and GM assembly in the transplant experiment (Experiment 2). (A–C) PCoA of microbial communities 2 weeks after the transplant, using Bray–Curtis dissimilarity indices, when considering all samples simultaneously (A), BPK samples only (B), and GM samples only (C). (D) α-diversity (OTU richness) in the BPK and GM of recipient Daphnia. Bars indicate mean values, points indicate specific values for each population.

