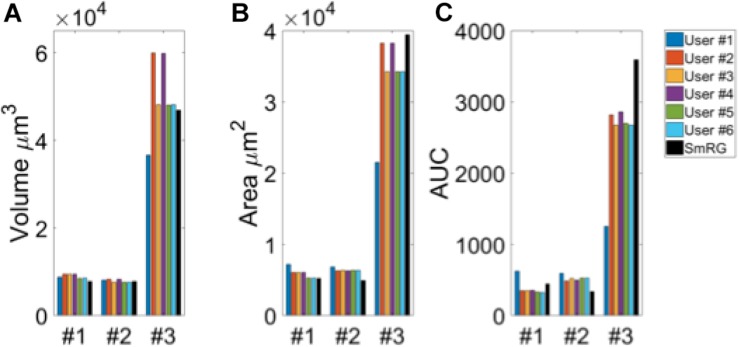
FIGURE 4.
Testing SmRG accuracy (A) Neuron volume. (B) Neuron surface. (C) AUC (area under the curve) of Sholl profiles. Friedman’s test was performed with Volume, Area and AUC as blocking factors (rows, nuisance effects) with replicates (neurons #1, #2 and #3), and with users and SmRG as treatments (column). No statistical differences were observed (p-value = 0.8233).

