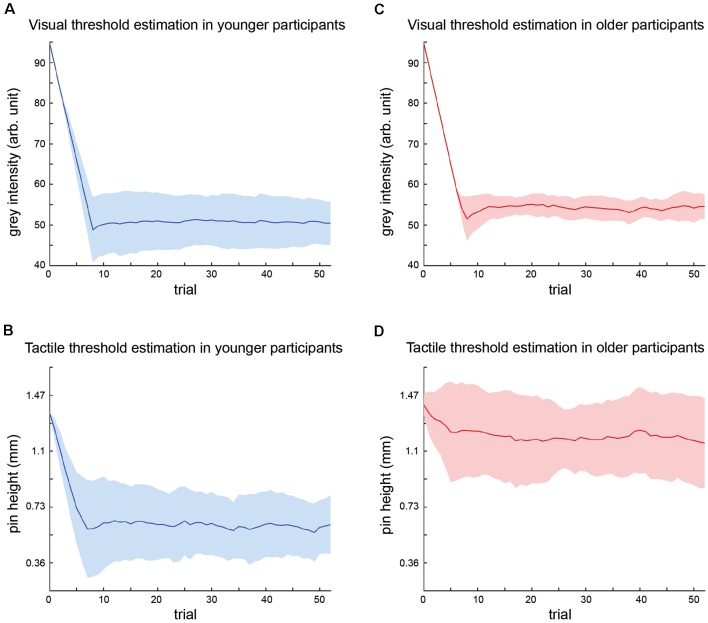
Figure 2.
Summary of threshold estimations for visual and tactile stimulus intensities. Graphs depict the mean stimulus intensity (y-axis) per trial (x-axis) during the course of the adaptive staircase over all participants (younger group = blue; older group = red) with standard deviations (SDs; colored areas). The number of trials equals trials in shortest threshold estimation procedure, i.e., trials common to all participants. (A) Visual threshold estimation in younger participants. (B) Tactile threshold estimation in younger participants. (C) Visual threshold estimation in older participants. (D) Tactile threshold estimation in older participants.

