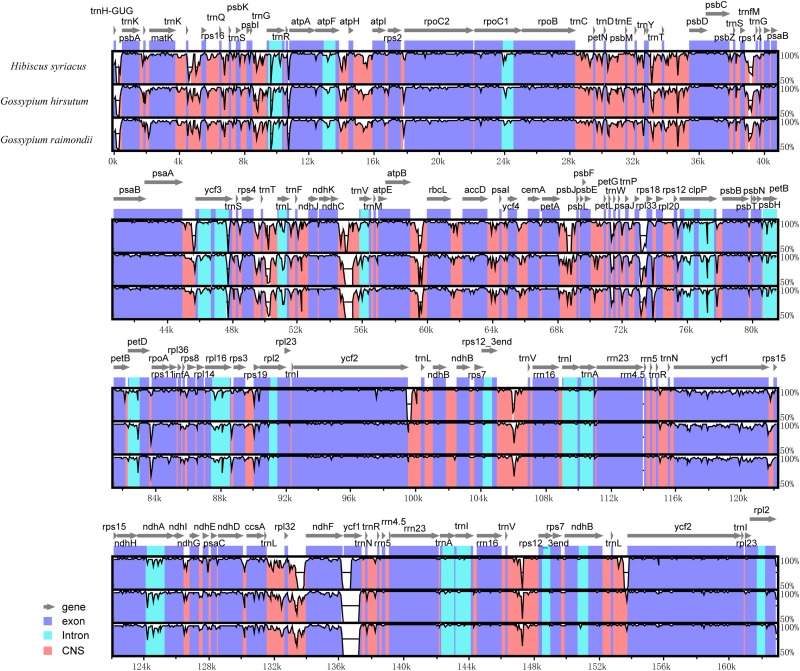
FIGURE 4.
Sequence identity plot comparing the chloroplast genome of Hibiscus cannabinus. Hibiscus syriacus, Gossypium hirsutum, and Gossypium raimondii. The vertical scale indicates the percentage of identity, ranging from 50 to 100%. The horizontal axis indicates the coordinates within the cp genome. Genome regions are color-coded as protein-coding, rRNA, tRNA, intron, and conserved non-coding sequences (CNS).

