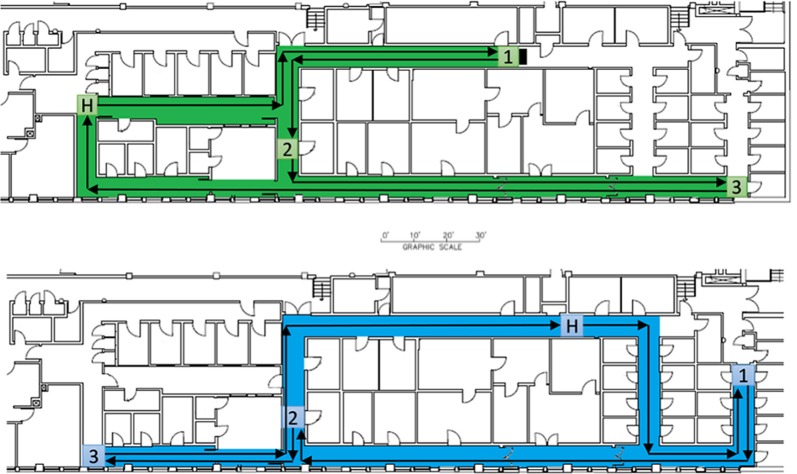
Figure 1.
Building floorplan and maps for the two experimental conditions. The highlighted region of the floorplan was selected for the map. The four, square regions in each map represent the three objects and home locations of the maps. The arrows illustrate an example of optimal route efficiency for successful wayfinding (start and end at H).

