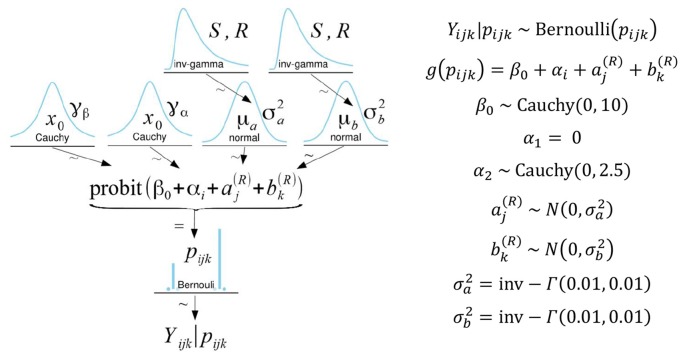
Figure 5.
On the left is a diagram illustrating the model, priors, and hyperpriors used in the analysis. Specific model parameters are listed on the right. α1 is set to zero as a constraint for model identification such that α1 reflects the baseline condition (HIM). Therefore, α2represents the effect of the DIM relative to the HIM (Song et al., 2017). In the model, the subscripts i, j, and k refer to the interface, target, and participant, respectively.

