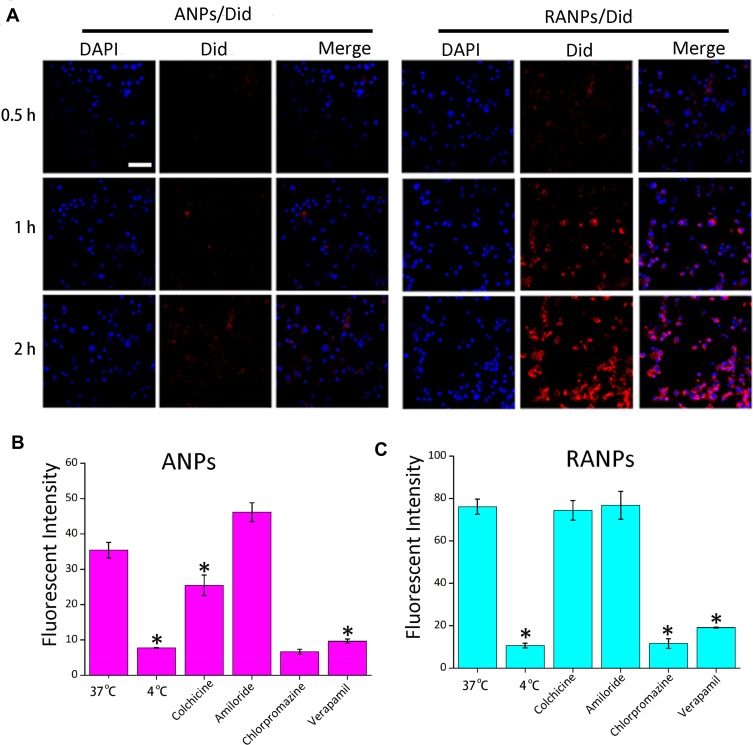
Figure 3.
(A) Representative confocal laser scanning microscopy images of B16F10 cells after incubation with ANPs/Did and RANPS/Did for 0.5 hr, 1 hr, and 2 hrs. DAPI stains for cell nuclei (blue); Did represents NPs or RNPS (red). Scale bar represents 100 µm. (B, C) Internalization pathways of ANPs and RANPs in B16F10 cells. B16F10 cells were preincubated under various conditions, including 4°C, chlorpromazine, verapamil, amiloride, and colchicine. Data represent means ± SD (n = 3). *p < 0.05 vs 37°C.

