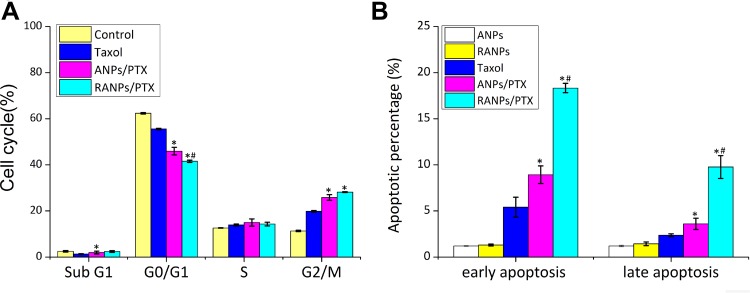
Figure 7.
(A) Cell cycle distributions of B16F10 cells after various treatments with equivalent doses of PTX. (B) The apoptotic cell percentages of B16F10 cells after various treatments of blank ANPs, blank RANPs, Taxol, ANPs/PTX, and RANPs/PTX. An equivalent dose of 1 μg/mL PTX was used, and the concentrations of blank nanoparticles were maintained the same as the PTX-loaded nanoparticles. Data represent means ± SD (n = 3). *p < 0.05 vs Taxol, #p < 0.05 vs ANPs/PTX.

