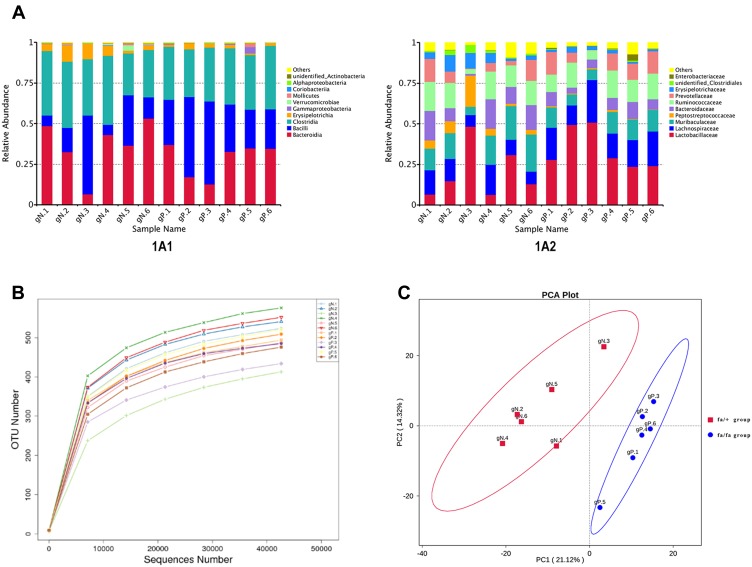
Figure 1.
(A) Relative Abundance. Relative gut microbiota abundance at class (A1) and family (A2) level in fa/fa group and fa/+ group. Sample Name gN.1 to gN.6 belonged to fa/+ group, gP.1 to gP.6 belonged to fa/fa group. (B) Rarefaction curve of each sample with 97% identity. (C) PCA Plot. The abscissa represents the first principal component (PC1). The ordinate represents the second principal component (PC2). The percentage represents the contribution value of PC1 or PC2 to the sample difference.

