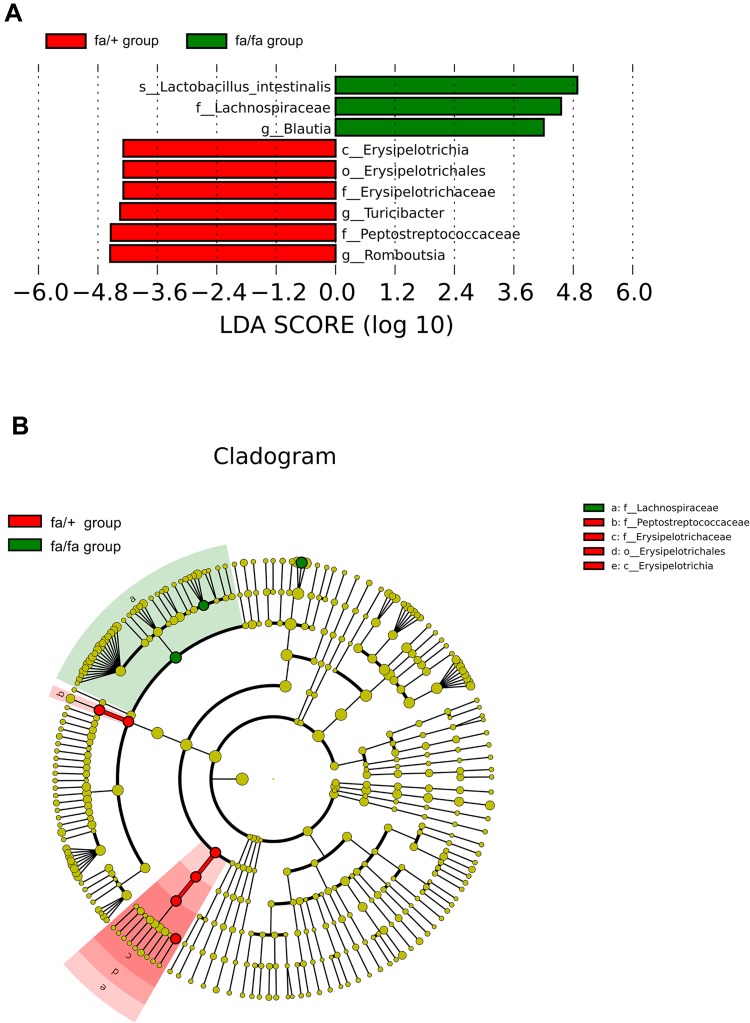
Figure 3.
LEfSe (LDA Effect Size) can discover and interpret high-dimensional biomarkers, and emphasize statistical significance and biological correlation between groups. (A) Distribution histogram of LDA values shows the species only with LDA Score larger than 4, the length of which represents the impact size of different species (LDA Score). (B) Cladogram represents the taxonomic levels from phylum to species. The diameter of each small circle is proportional to the relative abundance.
Abbreviations: c, class; o, order; f, family; g, genus; s, species.

