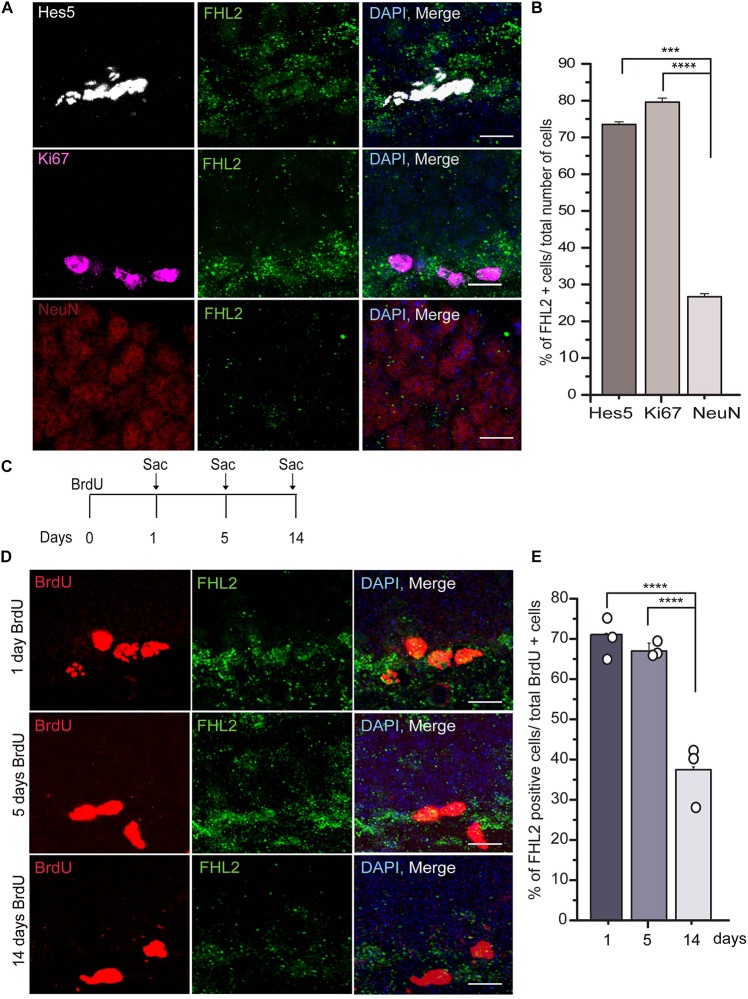
FIGURE 2.
FHL2 expression across developmental time in the dentate gyrus. (A) Representative images of Hes5, Ki67, and NeuN positive with FHL2 colocalization. (B) Quantification of the percentage of FHL2 positive cells in a total number of Hes5, Ki67 and NeuN positive cells. One way ANOVA F(2,87) = 10.399, P < 0.001. Followed by post hoc Tukey HSD test, Hes5 vs. Ki67 (p > 0.05), Hes5 vs. NeuN (p = 0.001) and Ki67 and NeuN (p < 0.001). (C) Timeline for BrdU injection to label the proliferating cells. (D) Representative images of BrdU positive cells colocalized with FHL2 at 1 day, 5 days, and 14 days post-injection. (E) Quantification of colocalization of FHL2 with BrdU positive cells at 1, 5, and 14 days after injection. One way ANOVA F(2,31) = 14.861, P > 0.001. Followed by post hoc Tukey HSD test, BrdU d1 vs. BrdU d5 (p > 0.05), BrdU d1 vs. BrdU 14 (p < 0.001) and BrdU d5 vs. BrdU14 (p < 0.001). Data are presented as mean ± SEM. Scale bar, 10 μm. N = 3 mice per condition.

