FIGURE 7.
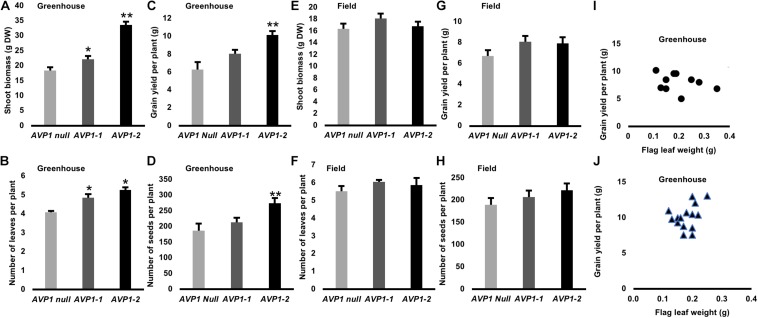
Shoot growth and yield attributes of transgenic wheat plants expressing AVP1 under optimal growth conditions in green house and field: (A,E) shoot biomass (g DW), (B,F) Number of leaves per plant (C,G) Grain yield per plant, (D,H) Number of seeds per plant. Two independent single gene transformation events analyzed, along with the respective null segregants, which had segregated from each of the lines at the T1 stage. Results are the mean ± SE (n = 15 independent plants per line). Significant differences between transgenic and null plants using Dunnett’s multiple comparison test: *P < 0.05 and **P < 0.01. (I) Relationship between flag leaf weight (g) and grain yield per plant (g) of transgenic wheat plants expressing AVP1 under optimal growth conditions in green house. Two independent single gene transformation events analyzed [AVP1-1 marked as circles, n = 10 independent plants (I) and AVP1-2 marked as triangles, n = 13 independent plants (J)], which had segregated from each of the lines at the T1 stage. Person correlation coefficient (r = 0.3113) was calculated with two tailed P-values and 95% confidence interval.

