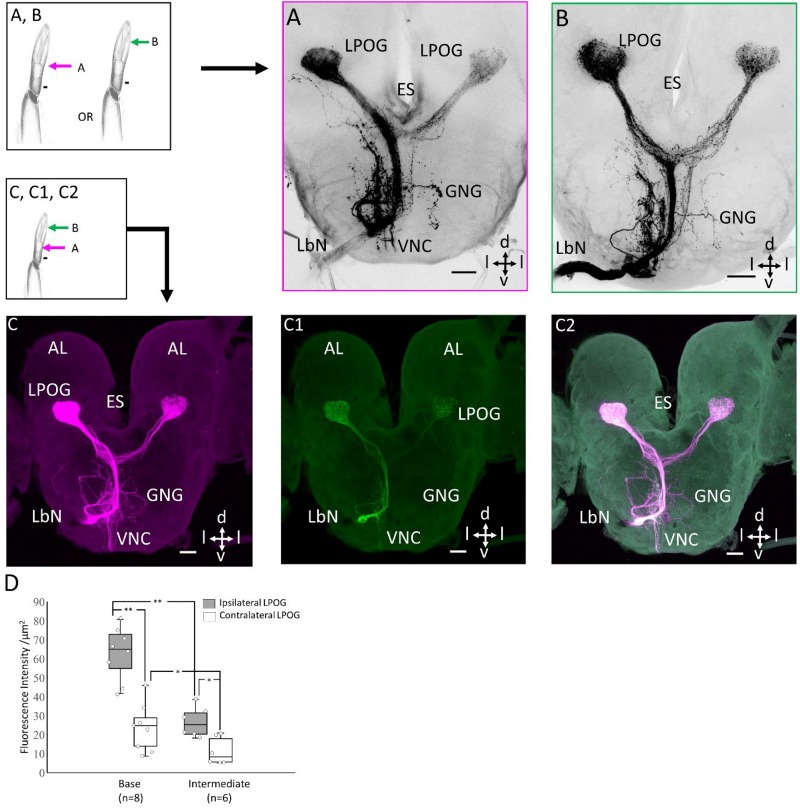
FIGURE 3.
Staining patterns of sensory neurons originating from different segments of the peripheral labial palp. Left upper: Demonstration of application of dye in base or intermediate part of labial palp. Left lower: Schematic diagram showing double-labeling of the labial palp. (A) Confocal image of a classic mass staining performed from the transverse cut, at the level of the base of the pit. (B) Confocal image of a classic mass staining performed from the transverse cut, at the intermediate level of the pit. (C–C2) Double-labeling of the staining experiments performed in A and B in the same preparation. A difference in fluorescence intensity between the two LPOGs is shown in C and C1. (D) Box plots of quantitative measurements of mean fluorescence intensity in the ipsilateral (light gray) and contralateral LPOG (white) when the preparation is stained from the base and intermediate part of the labial palp. Wilcoxon signed-rank test *p < 0.05; **p < 0.01. ES, esophagus; GNG, gnathal ganglion; d, dorsal; v, ventral; l, lateral. Scale bars (A–C): 50 μm.

