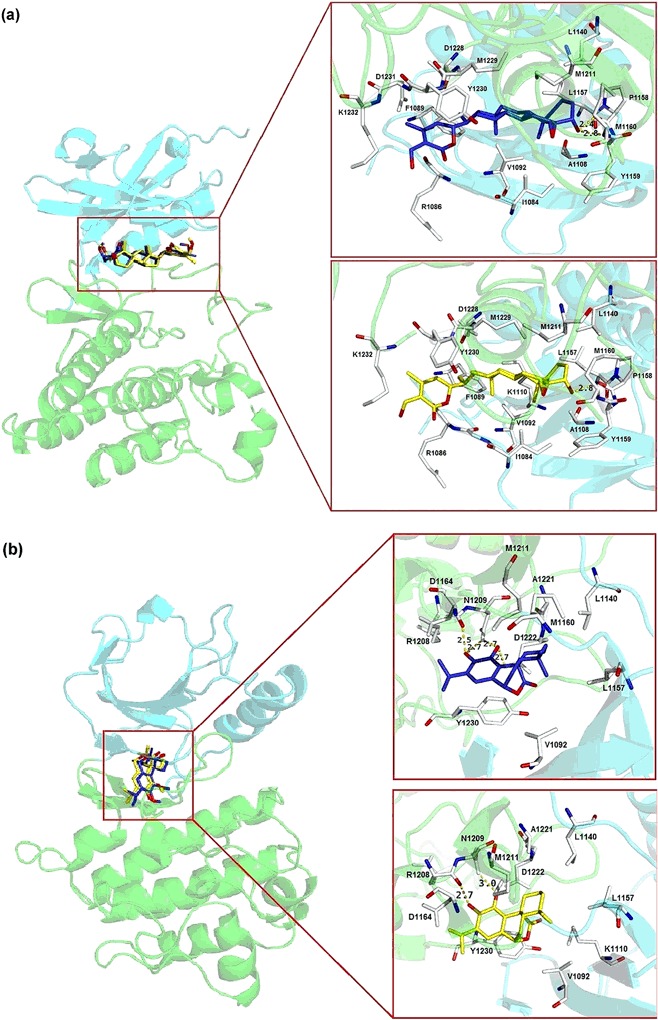
Fig. 2.

Binding poses of the two hit molecules: a 1R0P in complex with ZINC08234189, and b 2RFS in complex with ZINC03871891. The N and C lobes of tyrosine kinase domain are shown in cyan and green, respectively. The predicted binding mode using Autodock 4.2 and Vina are displayed in blue and yellow stick representation, respectively. Key residues involved in interaction are represented in the stick format. The length of Hydrogen bonds colored as yellow dotted lines is indicated in Angstrom (color figure online)
