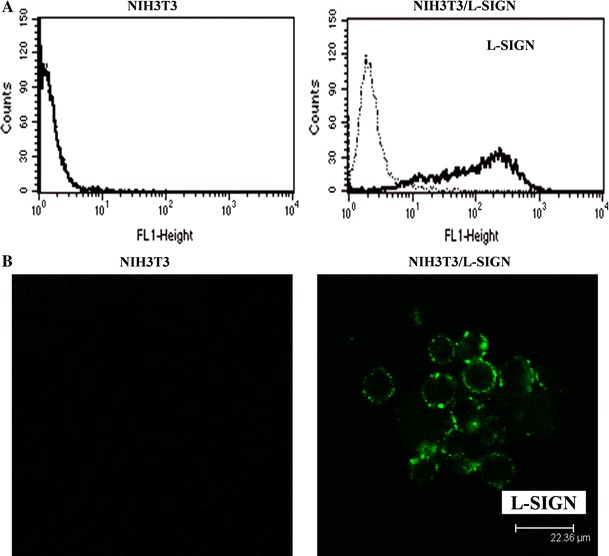
Fig. 1.

a Expression of L-SIGN on NIH3T3 and NIH3T3/L-SIGN. Cells were incubated with mouse anti-L-SIGN mAb (thick lines) or isotype control (dotted lines). Expression of L-SIGN was detected by flow cytometry using FITC-conjugated goat anti-mouse IgG. The results are representative of three experiments. b Confocal microscopy was carried out to characterize cellular localization of L-SIGN on NIH3T3 and NIH3T3/L-SIGN. Cells were stained with mouse anti-L-SIGN mAb and FITC-conjugated goat anti-mouse IgG. The results are reproducible in two experiments, and representative fields are shown
