Fig. 7.

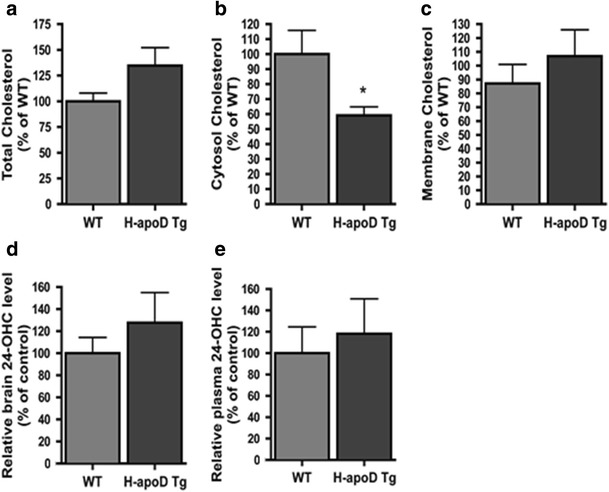
Cholesterol metabolism in H-apoD Tg mice. Cholesterol levels were assessed in whole (a), cytosolic (b) and membrane (c) fractions of brain homogenates in WT and H-apoD Tg mice using the Amplex red assay. Values were normalised by the total protein content of each fractions. Each graph represents the mean values ± SEM (n = 3 to 6 animals for each group), normalised by WT mice, which was given an arbitrary value of 100 %. Note that only the cytosolic fraction of H-apoD Tg brain was statistically different from WT. Unpaired t test: *p = 0.0283 compared with WT mice. d, e 24-Hydroxycholesterol (24-OHC) quantification in brain homogenates (d) and plasma (e) of WT and H-apoD Tg mice. Each graph represents the mean values ± SEM (n = 3 to 4 animals for each group), normalised by WT mice, which was given an arbitrary value of 100 %
